

Difficulty: Beginner
Prerequisites
- This project requires the following Python modules to be installed on your computer:
pygame
Background
A random walk is the tracing of a particle which repeatedly and randomly chooses whether to go either left or right (or either up or down). This is useful in many situations where the something’s motion is extremely unpredictable, like the value of a stock.
Compare the simulated paths (blue) of colliding gas molecules on the left with a 2D random walk on the right.
Bounded 2D Random Walk
The King of Programmia has come up with a new sport: Dizzy Walk. The blindfolded competitors start together in the center of an arena, then spin around many times to make them dizzy and lose all sense of direction. The first to reach the edge of the arena wins. In competitive play, the competitors end up so dizzy that they cannot walk in a straight line and each of their successive steps is in a completely random direction. The King wants to build a new Dizzy Walk arena, but he is afraid of making it too big, such that the competitors will take too long to reach the edge and the spectators will become bored. So, he has asked you to find how the average number of steps for one Dizzy Walker to reach the boundary changes depending on the dimensions of the square arena and the number of competitors.
- Download the zip file from here and unzip the contents to a folder.
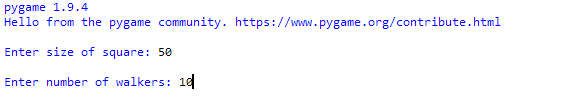
- Run the program
run_random_walk.py. - Type in the desired bounds and the number of random walkers. Don’t make the bounds too big, or the program may take a very long time to finish!
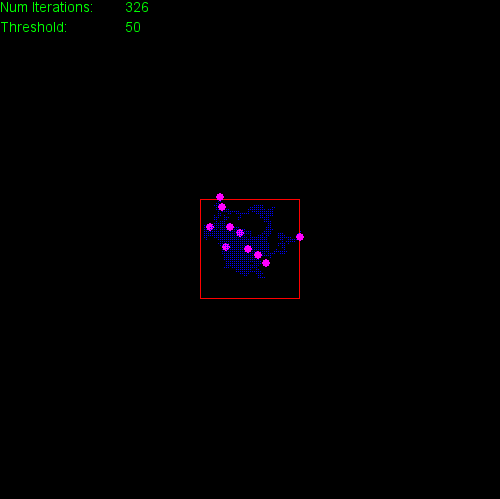
- Wait for one of your walkers to reach the boundaries, and note how many steps it took.
- Then, keeping the boundary size the same, change the number of walkers, getting at least 10 data points with different walker values.
- Then, keeping the number of walkers the same, change the size of the boundaries, getting at least 10 data points with different boundary values.
- Graph your results on two graphs with number of steps on the y-axis and what you changed (number of walkers or boundary size) on the x-axis.
Looking Back
- On average, how does the number of steps change with the size of the boundary? Is it linear? Quadratic? Something else?
- On average, how does the number of steps change with the number of walkers? Is it linear? Quadratic? Something else?
- Observe the spacing between the walkers over time. Do they spread out or stay tightly clumped?
- If your walkers represent gas particles that start from a single concentrated source (say, a leaky pipe), what would you predict about the distribution of the gas in the surrounding air over time?