

Difficulty: Advanced
Prerequisites
- This project requires knowledge of how to code in Python.
- This project requires the following Python modules to be installed on your computer:
pygame
Background
This project is inspired by the Parable of the Polygons, which is an interactive website and highly recommended read. In short, we will focus on the idea of emergent behavior. A system displays emergent behavior when it looks coordinated from a high level, though each part actually operates relatively independently based only on its local environment.

A classic example of emergent behavior is an ocean wave. Each droplet of water in a wave doesn’t “know” it’s in a wave; it just reacts to the motion in the drops next to it. All of the droplets together form a wave, even though no individual droplet is “trying” to be part of a wave. In this case, we would say that the wave emerges from the individual droplets.
Anxious Neighbors
In a certain city in the Kingdom of Programmia, there are two competing sports teams: the Reds and the Blues. Every household in the city has chosen to root for one team or the other. Since these Programmians are such big fans, they all hang their team colors outside their houses. Though Programmians who root for different sports teams are generally kind to each other, Red fans who have way more Blue neighbors than Red neighbors feel lonely and unhappy, as do Blue fans who are heavily outnumbered by Red fans.
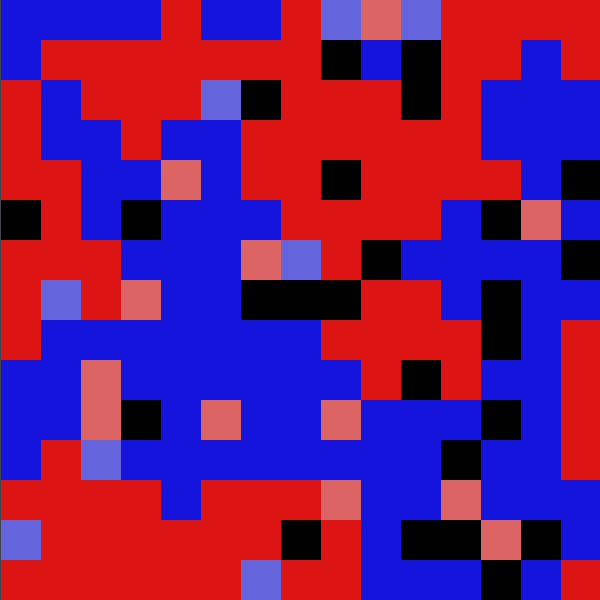
If a Programmian feels sufficiently outnumbered (represented by the light blue and light red squares above), they will move to somewhere else.
The King of Programmia has noticed that, even though each individual Programmian is fairly tolerant (only moving when they are significantly outnumbered), they still tend to separate out into Reds-only and Blues-only neighborhoods. The King wants you to find out more about this phenomenon.
What to Do
- Download
neighbors.pyfrom here. Open it, run it, and read the comments to figure out how it works. Notice how the grid starts completely randomized, but ends up relatively separated. - When we try to to experiments scientifically, it helps to have some numeric data. Write a Python function to give a numerical score how separated the grid is. Grids where each cell has mostly the same color around it should score high, while grids where the colors are intermixed should score low.
- A good problem-solving strategy is breaking the problem down into small pieces. First, come up with a scoring system to rank a single cell on how similar its neighbors are to it. Then, add up these scores for every cell, and you should have a pretty good overall scoring system.
- Remember, you don’t have to make everything from scratch. Examine the functions provided to you to see how you can make your job easier.
- Once you have completed the code to rank the grid’s level of segregation, run the grid simulation with different happiness thresholds (
lowSameness,highSameness), population density, and/or grid sizes, outputting the segregation over time. See what conclusions you can make from this data – graphing it might help.
Looking Back
- Does changing the lower or upper happiness threshold affect the level of segregation more? Does this depend on any other variables?
- Based on your experiments, would you expect a densely-populated city or sparsely-populated rural area of Programmia to be more segregated?
- What are the characteristics of the level of segregation over time? Does it always reach a final value? What characteristics of the simulation affect the shape and duration of the graph?
- How well do you think this model corresponds to similar situations in the real world? What are its limitations?
- Is your way of measuring segregation the only way? The best way? What might the consequences for your data if you adopted a different approach?