Plotting in Python

*Note to all users: As of 07/14/2019, all posts have been moved to (and are being updated at crivaldi.github.io . I don’t have plans to shut this site down, but I have no idea how long it will be maintained by the university in the future.*

Plotting in (mostly) Python*

*Note to class: some of these may be python 3 & most of what we’ve done so far has been in Python 2. Copy and paste with caution*


Installing the PlotNine Package (ggplots for python)

Class Specific notes/announcements – 11/1/18 – plotting links continued below

You do not need to have plotnine installed and working correctly to complete exercise 8. There is some example code in the exercise. We’ll go over this in office hours later today if it would be helpful.

MAC PEOPLE HAVING TROUBLE WITH PLOTNINE INSTALLATION

We have another thing to try for plotnine installation. We think that maybe if you start a fresh conda environment some of the dependency issues we’ve been having will be solved. Dr. Jones is waiting to see if we can get this working and then will figure out what to do from there.

In a fresh terminal, type

conda activate

Your terminal should process this for a minute and then your prompt should change from something like this: criva$ to something like this: (base) criva$

From there, you can try to use conda to install plotnine again: conda install -c conda-forge plotnine

Now open spyder and try out some of the plotnine commands. You can use the dataset mpg.txt from class (if you don’t have this dataset, you can download it here.)
import numpy
import pandas as pd
from plotnine import *

mpg=pd.read_csv("mpg.txt",sep="\t",header=0

a = ggplot(mpg,aes(x="displ",y="cty"))
a+geom_point()+coord_cartesian()

Let me know what happens – hopefully this forces a new environment which should fix the dependency nonsense we’ve been going through.

Some people were having issues with getting numpy re-installed on Wednesday – here is some code that should work for you. Let me know if this doesn’t work. If we didn’t talk about this, ignore it.

Code for numpy installation

  • Plotting in Pandas (python code): sudo pip install --upgrade --ignore-installed --install-option '--install-data=/usr/local' numpy

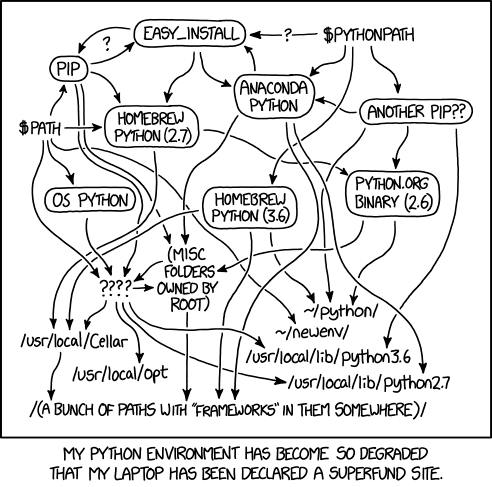
For what it’s worth, this dependency issue is not something unique to the class. See comic. (https://xkcd.com/1987/)


Links to plotting tutorials/resources

https://lmicke.github.io/first-ramen-post.html

https://lmicke.github.io/second-ramen-post.html#second-ramen-post

  • Bunch of different types of graphs and the code to make them (Python code):

https://python-graph-gallery.com/

  • Useful Python libraries:

https://blog.modeanalytics.com/python-data-visualization-libraries/

  • All python libraries (similar to R-cran)

https://pypi.org/

  • Lots of examples of ggplots2 graphs (R code):

http://r-statistics.co/Top50-Ggplot2-Visualizations-MasterList-R-Code.html#Slope%20Chart

  • Advanced data visualization ideas and examples (not necessarily tutorials and not exclusive to python)

http://sxywu.com/

Python In class challenge answers 10-26-18

Python In class challenge answers 10-26-18

Here are the answers to the python challenges this week in class. The formatting isn’t great here, so the link below will show another format if it’s which might be easier for you to understand/read.

https://hackmd.io/s/S1oyAag3Q#

# cumulative sum

x=[3,10,4,12,55]
cs=[0]*5

for i in range(0,len(x)):
cs[i]=sum(x[0:(i+1)])

print(cs)

x=[3,10,4,12,55]
cs=list()

for i in range(0,len(x)):
cs.append(sum(x[0:(i+1)]))

print(cs)

#how long to 5 5’s

x=[5,3,2,5,5,1,2,5,3,5,1,5,1]

count=0
i=0

while count < 5:
if x[i]==5:
count+=1
i+=1

print(i)

Answers for Lecture 11 extra practice

#

import pandas as pd

# 0 – calculate sum of female and male wages in wages.csv
wages=pandas.read_csv(“wages.csv”,header=0,sep=”,”)

femaleSum=0
maleSum=0

for i in range(0,len(wages),1):
if wages.gender[i]==”female”:
femaleSum=femaleSum+wages.wage[i]
else:
maleSum=maleSum+wages.wage[i]

femaleSum
maleSum

#the two commands below won’t work – why?

sum(wages.gender==”female”)
sum(wages.gender==”male”)

 Find runs –

This is the super abstract one we went over in Tutorial!

# load file – available on Sakai
findRuns=pd.read_csv(“findRuns.txt”,header=None,sep=”\t”)

# create a variable out that is currently undefined
out=pd.DataFrame(columns=[‘startIndex’,’runLength’])

# I will use this variable cur to hold onto the previous number in the vector;
# this is analagous to using findRuns[i-1]
cur=findRuns.iloc[0,0]
#cur=findRuns[i-1]
# this is a counter that I use to keep track of how long a run of repeated values is;
# if there are not repeated values than this count equals 1
count=1

# loop through each entry of our vector (except the 1st one, which we set to cur above)
for i in range(1,50,1):
# test if the ith value in the vector findRuns equals the previous (stored in cur)
if findRuns.iloc[i,0]==cur:
# test whether count is 1 (we aren’t in the middle of a run) or >1 (in the middle of a run)
if count==1:
# if the ith value in the vector equals the previous (stored in cur) and count is 1, we
# are at the beginning of a run and we want to store this value (we temporarily store it in ‘start’)
start=(i-1)

# we add one to count because the run continued based on the ith value of findRuns being equal to
# the previous (stored in cur)
count=count+1
# if the ith value in findRuns is not the same as the previous (stored in cur) we either are not in a run
# or we are ending a run
else:
# if count is greater than 1 it means we were in a run and must be exiting one
if count>1:
# add a row to ‘out’ that will hold the starting positions in the first column and the length
# of runs in the second column; this appends rows to out after finding and counting each run
out.loc[len(out)]=[start,count]
# reset count to 1 because we just exited a run
count=1
# remember cur holds the previous element in findRuns, so we need to update this after each time
# we go through the for loop
cur=findRuns.iloc[i,0]
cur
out

Python intro

*Note to all users: As of 07/14/2019, all posts have been moved to (and are being updated at crivaldi.github.io . I don’t have plans to shut this site down, but I have no idea how long it will be maintained by the university in the future.*

Getting started with Python

Helpful, lengthy explanation of indexes and slices in arrays: https://stackoverflow.com/a/24713353

Numpy

Numpy is a library for arrays.

Numpy basics: https://docs.scipy.org/doc/numpy-1.15.0/user/quickstart.html

More explanation of data types (numpy): https://docs.scipy.org/doc/numpy-1.15.0/user/basics.types.html

Why do we want to use numpy vs regular python lists? https://stackoverflow.com/questions/993984/what-are-the-advantages-of-numpy-over-regular-python-lists

Pandas

Pandas is a python library for data frames. Understanding the basics of numpy will be helpful before getting into pandas.

Pandas introduction: http://pandas.pydata.org/pandas-docs/stable/10min.html

And another: https://www.learnpython.org/en/Pandas_Basics

Selecting data in a dataframe (iloc): https://www.shanelynn.ie/select-pandas-dataframe-rows-and-columns-using-iloc-loc-and-ix/

Tutorial Challenge from 10/05/18 – Prompt and corresponding code