*Note to all users: As of 07/14/2019, all posts have been moved to (and are being updated at crivaldi.github.io . I don’t have plans to shut this site down, but I have no idea how long it will be maintained by the university in the future.*
Plotting in (mostly) Python*
*Note to class: some of these may be python 3 & most of what we’ve done so far has been in Python 2. Copy and paste with caution*
Installing the PlotNine Package (ggplots for python)
Class Specific notes/announcements – 11/1/18 – plotting links continued below
You do not need to have plotnine installed and working correctly to complete exercise 8. There is some example code in the exercise. We’ll go over this in office hours later today if it would be helpful.
MAC PEOPLE HAVING TROUBLE WITH PLOTNINE INSTALLATION
We have another thing to try for plotnine installation. We think that maybe if you start a fresh conda environment some of the dependency issues we’ve been having will be solved. Dr. Jones is waiting to see if we can get this working and then will figure out what to do from there.
In a fresh terminal, type
conda activate
Your terminal should process this for a minute and then your prompt should change from something like this: criva$ to something like this: (base) criva$
From there, you can try to use conda to install plotnine again: conda install -c conda-forge plotnine
Now open spyder and try out some of the plotnine commands. You can use the dataset mpg.txt from class (if you don’t have this dataset, you can download it here.)
import numpy

import pandas as pd

from plotnine import *
mpg=pd.read_csv("mpg.txt",sep="\t",header=0
a = ggplot(mpg,aes(x="displ",y="cty"))

a+geom_point()+coord_cartesian()
Let me know what happens – hopefully this forces a new environment which should fix the dependency nonsense we’ve been going through.
Some people were having issues with getting numpy re-installed on Wednesday – here is some code that should work for you. Let me know if this doesn’t work. If we didn’t talk about this, ignore it.
Code for numpy installation
- Plotting in Pandas (python code):
sudo pip install --upgrade --ignore-installed --install-option '--install-data=/usr/local' numpy
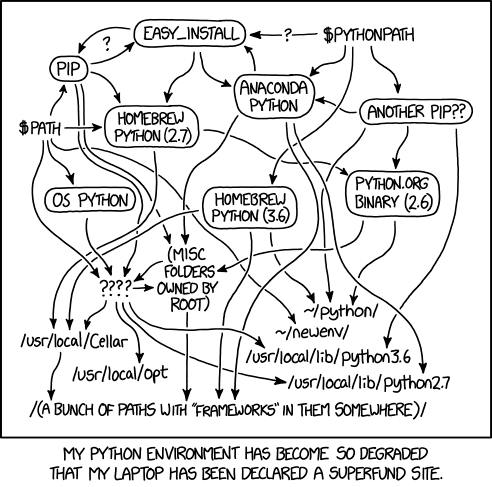
For what it’s worth, this dependency issue is not something unique to the class. See comic. (https://xkcd.com/1987/)

Links to plotting tutorials/resources
https://lmicke.github.io/first-ramen-post.html
https://lmicke.github.io/second-ramen-post.html#second-ramen-post
- Bunch of different types of graphs and the code to make them (Python code):
https://python-graph-gallery.com/
- Useful Python libraries:
https://blog.modeanalytics.com/python-data-visualization-libraries/
- All python libraries (similar to R-cran)
- Lots of examples of ggplots2 graphs (R code):
http://r-statistics.co/Top50-Ggplot2-Visualizations-MasterList-R-Code.html#Slope%20Chart
- Advanced data visualization ideas and examples (not necessarily tutorials and not exclusive to python)
- If you’re using jupyter notebooks, here are some tips: https://www.dataquest.io/blog/jupyter-notebook-tips-tricks-shortcuts/