
Varieties of Democracy
provides the most fine-grained and multidimensional data on democracy. More than 3,000 country experts have contributed to this project, which rates 201 countries on 450 aspects of democracy for 1789-2017. Go to the main site to get complete documentation about the project, download the current data, read working papers, explore the data with several interactive analysis tools, and more.
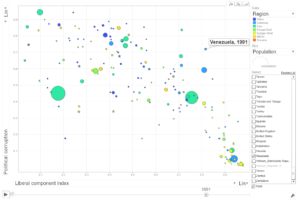
V-Dem motion charts
Motion charts are colorful animated scatterplots. They are a great way to see how the relationship between two variables changes historically. The main V-Dem site no longer has a motion chart. I make two of my own available here: one for all the data from 1900 through 2019, the other with selected Historical V-Dem variables going back to 1789. Unfortunately, these motion charts rely on Flash, which Chrome and most other browsers no longer run. These links are still live in case you have a browser that can run Flash. If the chart still will not load, you probably need to allow Flash in your browser. Instructions for doing this. Or you may need to install or update Flash. Instructions here. Finally, the motion chart is a big file, so it may be necessary to refresh or resume the download 2-3 times. Note: Some population figures are rough estimates, for display only.
I hope that eventually I or the V-Dem Institute will post an alternative that does not rely on Flash. In the meantime, here are two short videos that demonstrate visualization of relationships in V-Dem data using motion charts:
Video demonstration with regular V-Dem data
Video demonstration with Historical V-Dem data
Student motion charts for Visualizing Politics, Spring 2020
Student motion charts for Visualizing Politics, Spring 2019
Student motion charts for Visualizing Politics, Spring 2018