

These two days involved focusing on learning about and applying data assimilation in the lab.

Image source: http://bit.ly/VI9YI7
Students learned about PDA – parameter data-assimilation NOT public displays of affection (although successful parameters data-assimilation could make you want to celebrate with public displays of affection for your computer).
During these two days students learned:
- The need to test-run your model. If you know the model is wrong – tuning the parameters is not going to help.
- Adjusting your priors after your model run is a cardinal sin. The solution is not to move your prior, but rather to go back and work on your model!
- An interesting problem in the iterative process of modeling is knowing when to stop. When are your models good enough? How much uncertainty is acceptable? This is especially important when thinking about the interface between science and policy. What level of uncertainty is needed in order to make policy? While the course didn’t provide the answers to these questions – it did give students food for thought.
The students were able to assimilate the tree ring data measured from their tree cores into the PEcAn ecosystem model they had learned about on Day 3.
The following are some of the results from the tree ring data assimilation.
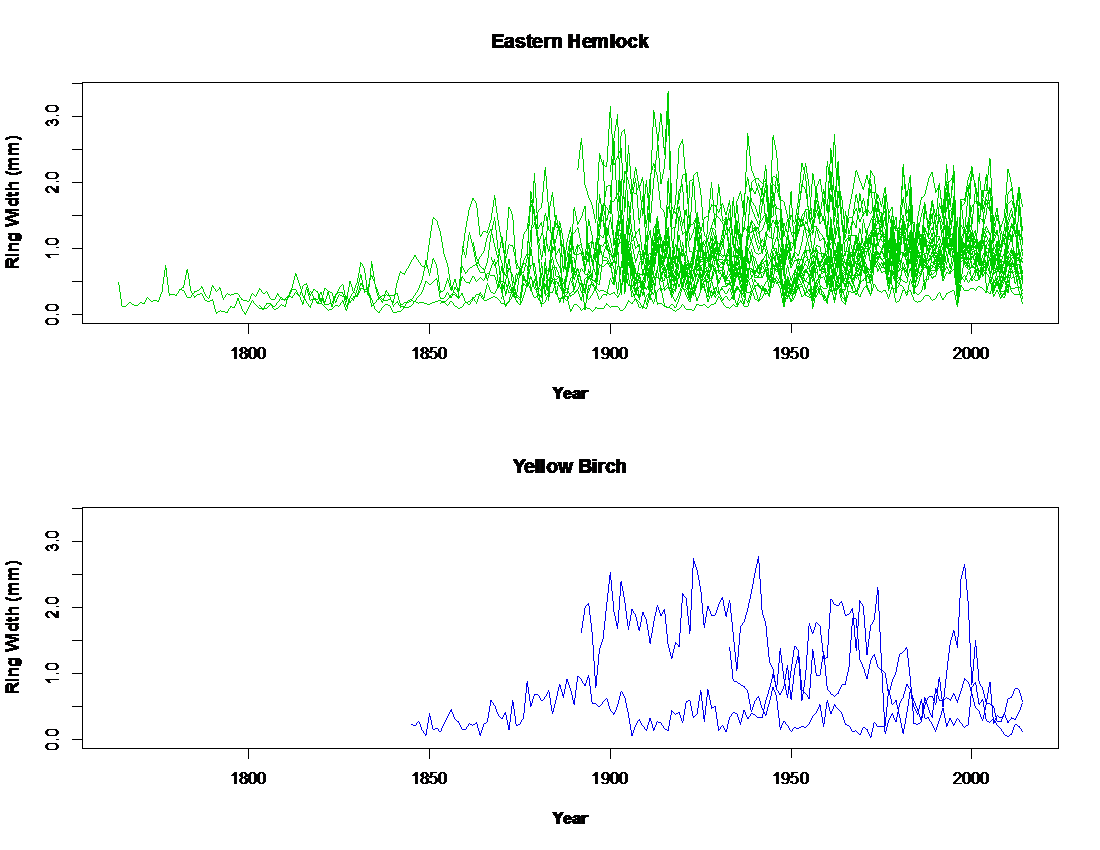
Figure 1. The ring widths from Eastern Hemlocks and Yellow Birches. Hemlocks went back to mid/early 1700s, birches to probably at least the early 1800s.
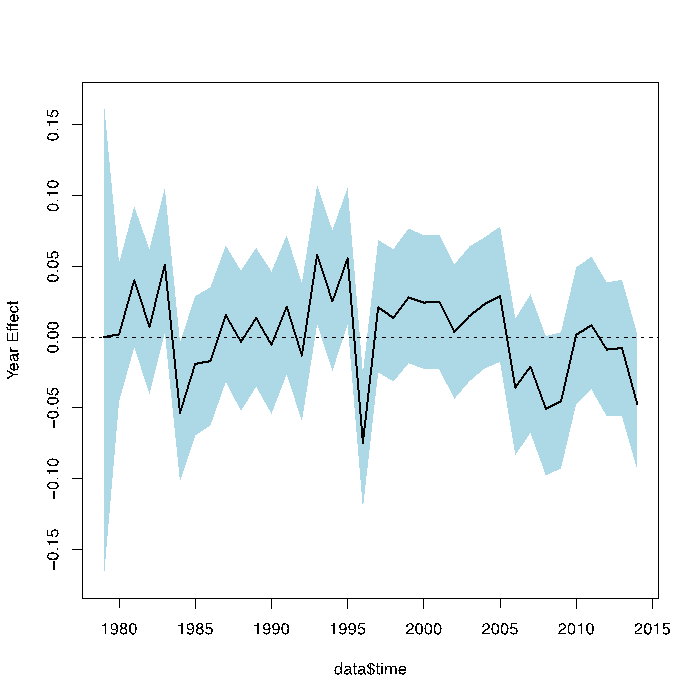
Figure 2. Tree Ring Year effects: For tree-ring folks, this is essentially your master chronology with uncertainty around it.
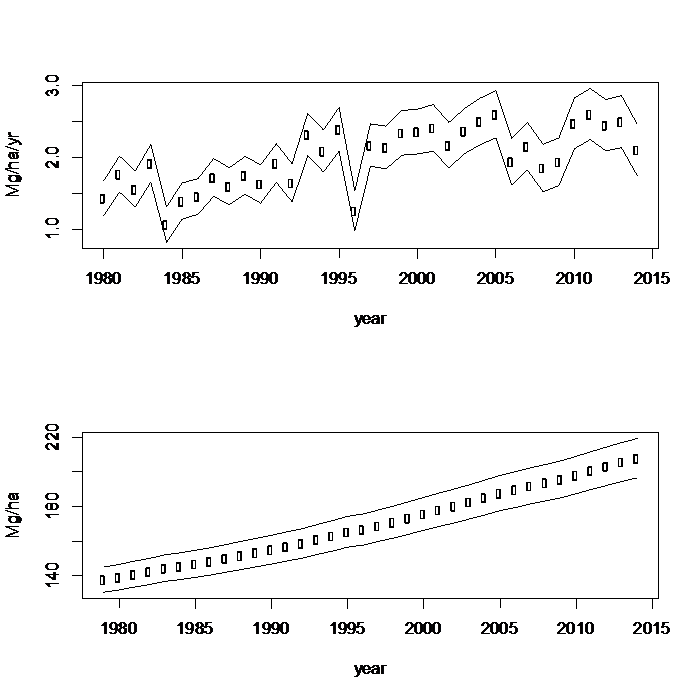
Figure 3. The above year effects can get combined with growth to look at annual aboveground biomass change (top) or cumulative aboveground biomass change (below).
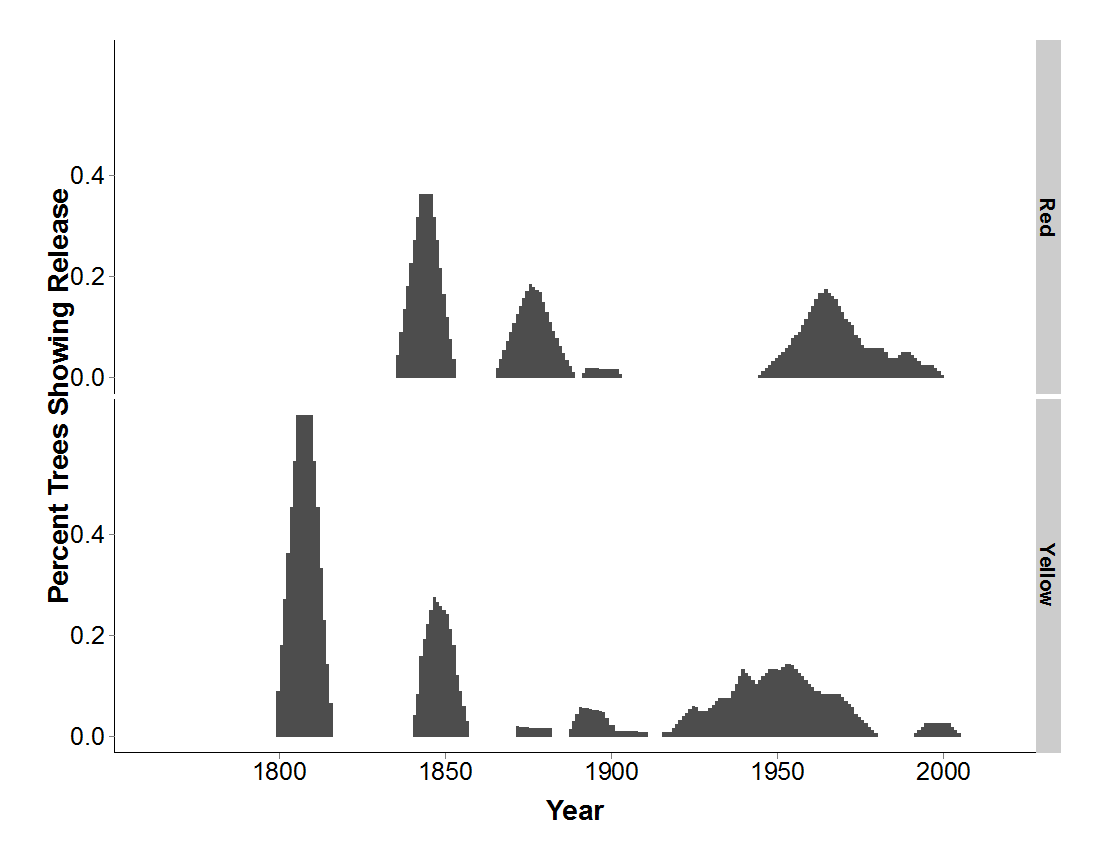
Figure 4. The tree rings can also be used to get a (rough) disturbance histories of the two plots (Red plot on top and Yellow plot on bottom).