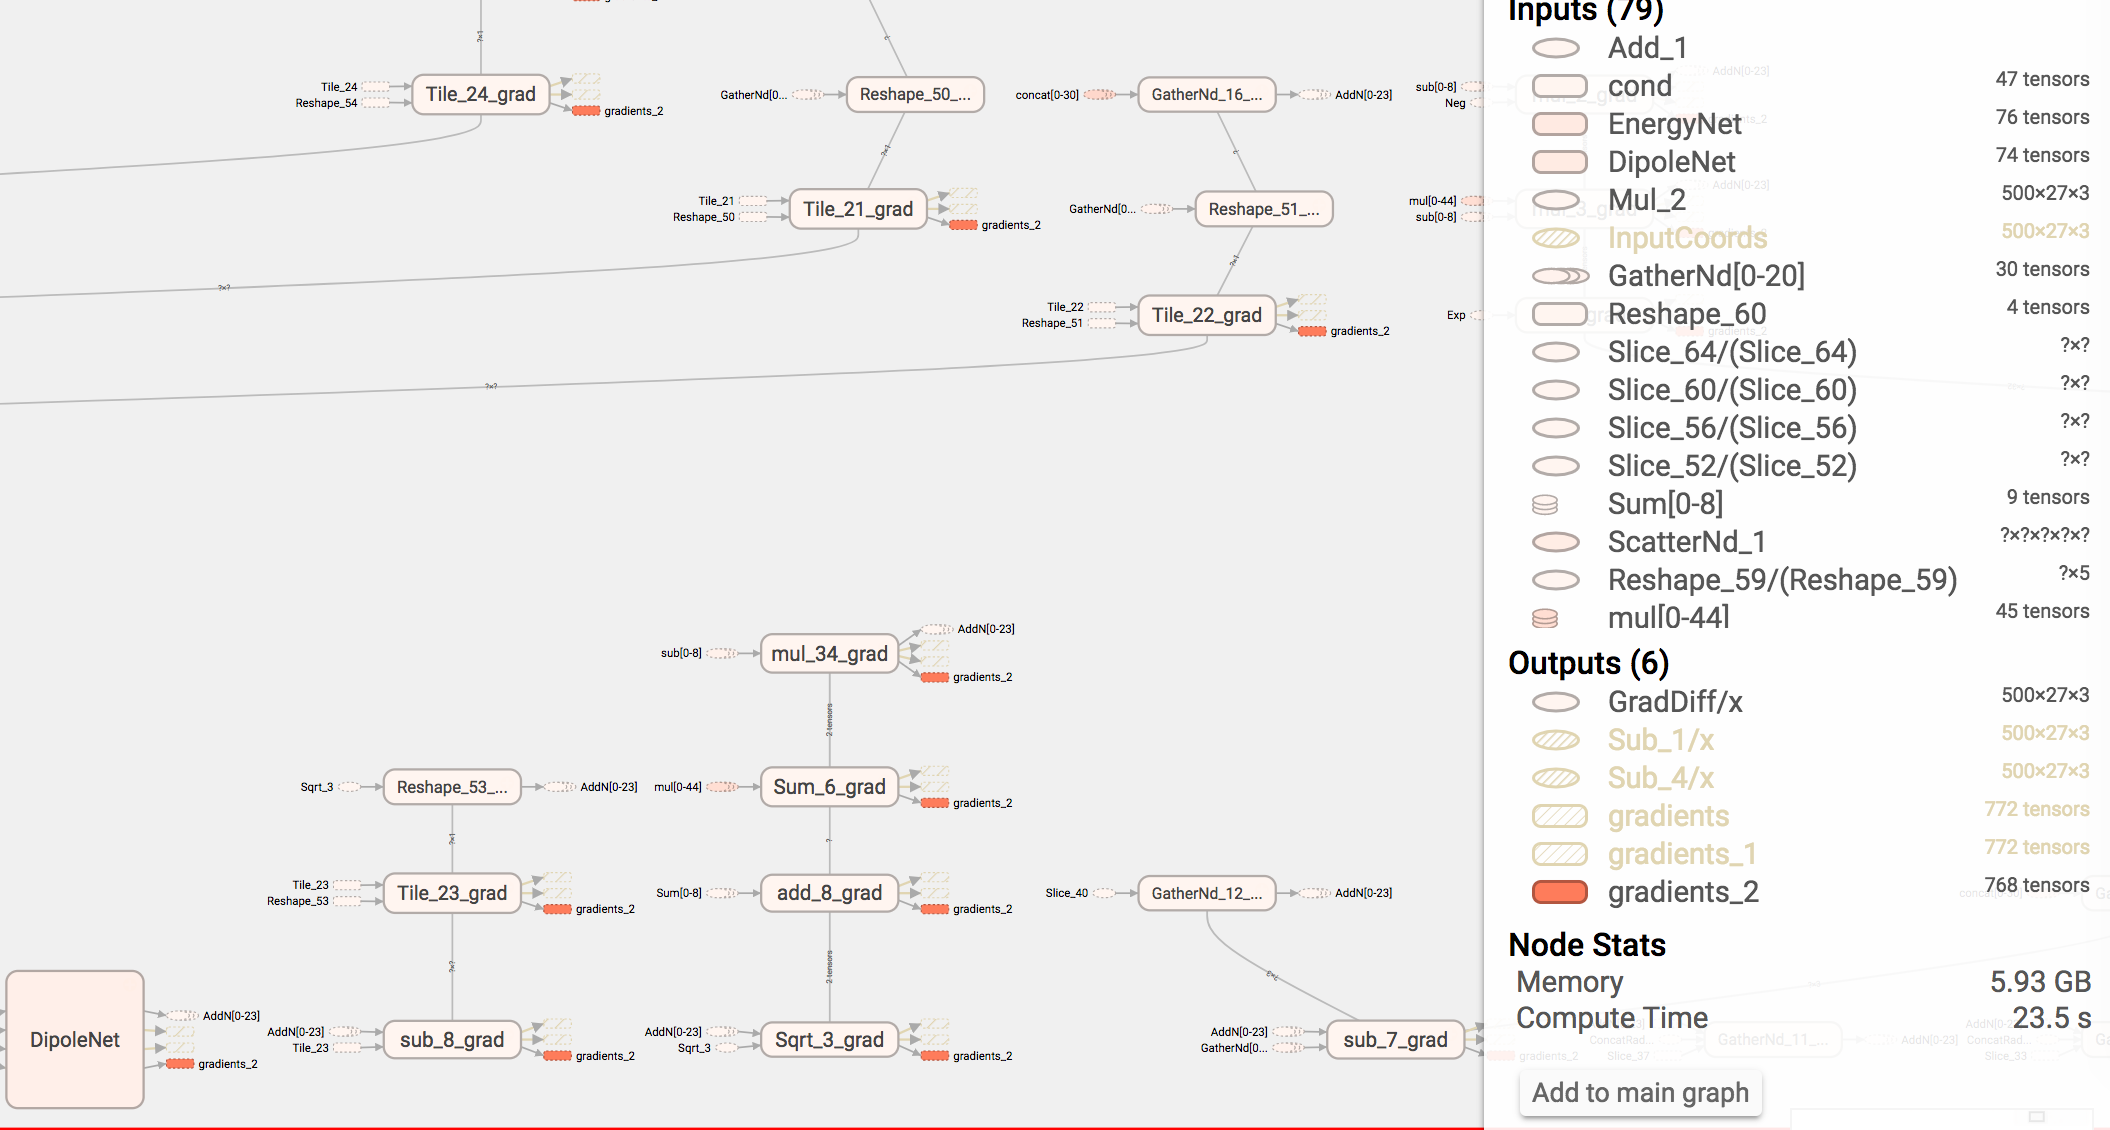
Just wanted to relay a little information which was useful. So we are producing a really complex neural network chemical model with hundereds of nodes and layers. This lead to only being able to (initially) fit small double-precision batches on the GPU. I wanted to explain how we debugged this….
Step 1: Add full profiling to the FileWriter and Graph Summaries.
self.options = tf.RunOptions(trace_level=tf.RunOptions.FULL_TRACE)
self.run_metadata = tf.RunMetadata()
self.summary_writer.add_run_metadata(self.run_metadata, "init", global_step=None)
Step 2: launch TensorBoard while profiling a training run.
tensorboard --logdir=PATHTONETWORK
Step 3: Point your browser to the locally hosted webpage tensorboard spins up. Pour over the graph and look at the memory usage of each fragment of the graph. naturally all the memory usage occurs mostly in the gradients which TensorFlow generates for training operations or the nuclear gradient for dynamics. In our case we learned that scatter_nd() which achieves the same effect as SparseTensor(), uses about two orders of magnitude more memory by default. Simply using SparseTensor instead fixed our issues. Happy hacking.
