Overview
- Time: 1 hour (5 introduction, 40 teaching, 10 activity, 5 wrap-up)
- Objectives
- Understand basic terms related to the field of data science
- Understand methodologies and when they should be used
- Articulate how these terms apply to your nonprofit organization
Introduction
- Write down any data science terms you have heard or used at work, regardless of whether or not you are more familiar with their definitions.
- Talk with a partner for a few minutes about what terms you have in common or that you might not have heard before, before convening with the entire group to compare similarities.
Key Terms to Know
The fields of data science and statistics are full of complex terms that relate to processes, methods, metrics, characteristics, and more. Due to the growing need for nonprofits to support themselves through data-driven evidence, it is likely that you will encounter many of these concepts in your work, even as an individual from a less-technical background. Therefore, you will likely benefit from a deeper understanding of many of these concepts and how they can be applied to their current work. As a helpful starting point, this workshop aims to help you understand some of the more commonly used terms, so that you may better navigate the key takeaways and apply them to the broader goals within your nonprofit.
Given the impossibility of covering all pertinent terms in one document, a few are summarized below. They have been divided into several categories to help guide your understanding.
Fields of Study
- Data Science – A field of study that uses raw data to create new ways of modeling and understanding the unknown.
- Statistics – Methods for planning experiments, obtaining data, organizing data, analyzing data , and interpreting it, to draw valuable conclusions.
- Descriptive Statistics – Numerical metrics used to measure and describe characteristics of a group. Includes measures the average value and the amount of variation in the data.
- Inferential Statistics – Procedures used to draw conclusions about larger populations from small samples of data.
- Data Mining – The process of analyzing data to extract information or find patterns to answer questions, understand future trends, and make more informed business decisions.
- Predictive Modeling – A data-mining technique used to predict future behavior of a population and anticipate the consequences of change.
- Artificial Intelligence (AI) – A field of study that involves programming machines or programs that simulate aspects of human intelligence, such as the ability to identify patterns and learn.
*At this point, it will be helpful to pause and recall the definitions of these terms. It may also be helpful to consider other related fields of study or techniques not mentioned here.*
Data Collection
Data are the roots of gathering information; they are what you use to derive insights. Therefore, it’s important to understand basic methods used to collect data, and potential pitfalls to consider. For example, gathering a lot of data can be time consuming and costly, especially depending on what type of data it is. It is also important to consider how that data is collected. If an individual simply collects data from whatever group of individuals are most readily available, the conclusions made may not accurately represent the population as a whole.
- Population – A group composed of the complete set of individuals/items that fit the category/description of what a group of researchers set out to study.
- Sample – A subset of the population chosen by researchers for a study. Since it is often too difficult to collect data on the entire population, using a subset can still provide useful insights on the population being studied.
- Simple Random Sample (SRS) – A sample of size n selected from the population so that each possible member has an equal chance of being selected.
- Stratified Random Sample – A sample of size n chosen by selecting members from subgroups of the target population in which all members in those subgroups have an equal chance of being included in the research.
- Cluster Sample – A probability sample in which clusters of participants within the population of interest are selected at random and data is collected from all individuals in each cluster.
- Systematic Sample – A probability sample that involves selecting every nth member on a list of population members to be included in the sample.
Types of Data
- Quantitative Data – Numerical data.
- Qualitative Data – Data that describes meaning and experiences. Often expressed in words e.g. case studies, interviews and observations.
- Discrete Data – Data that can only take certain values within a range.
- Continuous Data – Data that can take on any value within a range. There is no “space” between the data values.
- Ordinal Data – Data belongs to categories that are ordered or ranked. They are sometimes assigned “numerical” values but those values correspond to a subjective scale. (Example: 1st, 2nd, 3rd in a race or star ratings)
- Categorical / Nominal Data – Data that consists of names, labels, or other nonnumerical values.
In any statistical analysis, it is essential to be conscious of what types of data are being collected and analyzed. Each type of data offers valuable insights. Quantitative data can allow for easier comparisons between data points or allow for quantitative metrics, like the average, to be computed. Qualitative data is primarily used for data that may not be described by a number, such as a product brand. It is great for divergent forms of data, like quotes gathered from interviews.
*At this point, it will be helpful to pause and recall the definitions of these terms. It may also be helpful to consider other related fields of study or techniques not mentioned here.*
Common Metrics
- Average / Mean – The sum of the values divided by the number of values.
- Variance – The difference between the value expected (the average) and the values that are actually collected. It is also known as the standard deviation squared.
- Standard Deviation – A measure of variability that describes an average distance of every value collected from the mean. It is also known as the square root of the variance.
- Median – The “middle” value. When the data points are put in order, it is the value of the middle data point if there are an odd number of values and the average of the two middle data points if there are an even number of values.
- Outliers – Alternative term for errors or unexplained variability in a data sample. May be due to errors in how the data is labeled or in the values of the data themselves.
These are just a few of the many metrics that are commonly used. It is often important for statisticians to distinguish between when these metrics are applied to a collected sample or the population as a whole. The type of data being analyzed determines whether quantitative metrics (like average, variance, and standard deviation) or qualitative metrics (like mode) should be considered. Some metrics describe the “center” of the data, some describe the “spread”, and some describe the “correctness” of insights made about the data.
Other Popular Terms
- Statistical Analysis – Collecting and exploring data to determine underlying patterns and trends and to see the strength of potential relationships that among two or more variables.
- “Big Data” – Broad term for datasets that are large or complex. This term has gained popularity due to the increased amount of data gathered on consumers.
- Algorithm – A methodical, logical rule or procedure that humans or machines use to solve a particular problem.
- “Noise” – Alternative term for errors or unexplained variability in a data sample. May be due to errors in how the data is labeled or in the values of the data themselves
Use this link or the QR code to the right to access a Quizlet to help you review these items.

Activity
Either individually or in small groups, create a three-column chart on your piece of paper. Label the left side of the column “Term”, the middle “Representation”, and the right side “Application”. Choose the ten hardest terms to remember or understand and brainstorm an image, phrase, example, or equation, that makes it easier to remember it. Research that term online if extra clarification is needed. Then consider ways that term may apply to the data or practices that are part of your nonprofit.
Use the reference below as an example:
| Term | Representation | Application |
| Discrete Data | Possible data values take on “separate” values. Not possible for there to be a value in between two of them. Ex: Number of students b/c you can’t have ½ a student. |
At the Boys and Girls Club of St. Joseph County, it may be helpful to keep track of number of students who attended a teacher’s class that day, or number of absences a student had throughout the school year. |
| Continuous Data | Data that can take on values in between any other values Ex: Time, since it can always be subdivided. |
Can include tracking how long individuals volunteered with us for. |
| Stratified Random Sample | 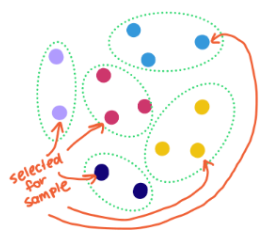 |
Useful if we want data on students from various counties and want to make sure sample includes students from every county. |
| Cluster Sample | 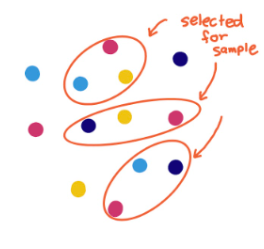 |
Useful if we want data on students from various counties and want to make each cluster be its own representation of students from various counties |
Closing Discussion
Though the terms and concepts explained here represent only the tip of the iceberg, they represent some of the key frameworks that shape the fields of data science and statistics. The topics here are meant to provide a roadmap in case further research and understanding is desired, like if participants seek to better understand specific analytical methods. Since it may be difficult to grasp all these terms in depth in the span of only an hour, it is recommended that participants review these terms on repeated occasions to better improve their memory.
Congratulations on completing this workshop! Please consider giving us feedback in our survey linked in the button below so that we can continue to improve our workshops.