Overview
- Time: 1.5 hours (5 pre-workshop, 20 teaching, 60 activity, 5 wrap-up)
- Objectives
- Understand what makes tidy/clean data
- Be able to name the importance of tidy/clean data as it relates to your own organization’s data
- Gain experience using OpenRefine as a tool to assist in cleaning data
Pre-Workshop & Required Materials
This workshop requires some additional resources. We will be working alongside one another to tidy a dataset and use OpenRefine, but first we have to ensure OpenRefine and our data is downloaded. This dataset is meant to emulate possible contact information for a nonprofit organization. See the directions below:
- Download the dataset from the link below:
- Download the appropriate version of OpenRefine for your device (Windows/Mac)
On a Windows computer, this application will download as a .zip file containing these files:
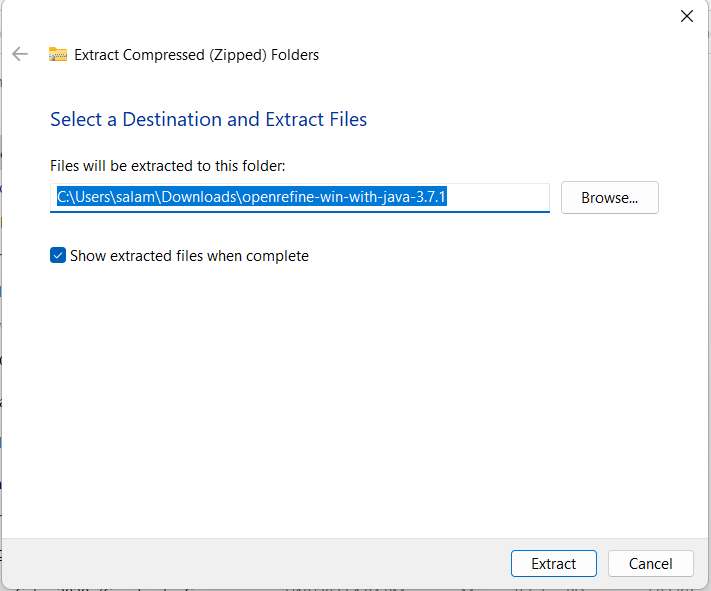
When your screen looks like this, open the application named “openrefine.” At this point, you may be prompted to Extract All files in the folder, Run anyways, or cancel. Select the option to Extract All. This will prompt another popup window in which the system will prompt you to choose where you would like the unzipped files to go.
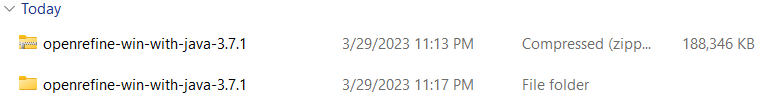
I recommend leaving this as the default, as it will create another folder in your Downloads with all of the unzipped files, which looks a little something like this:
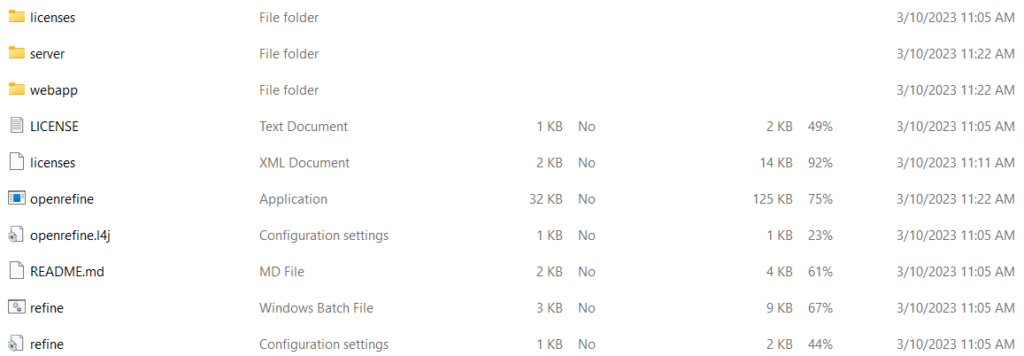
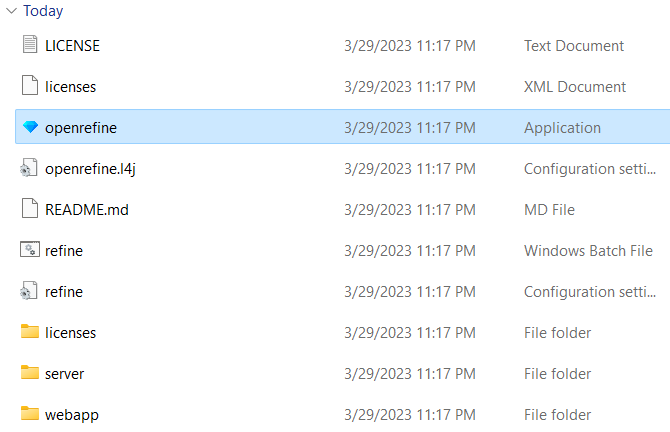
Open the unzipped folder, which is labeled “File folder” as opposed to being Compressed. You should see the following files.
Again, open the application file entitled “openrefine.” You will likely receive an error message such as the one below, given that OpenRefine is not a Microsoft application.
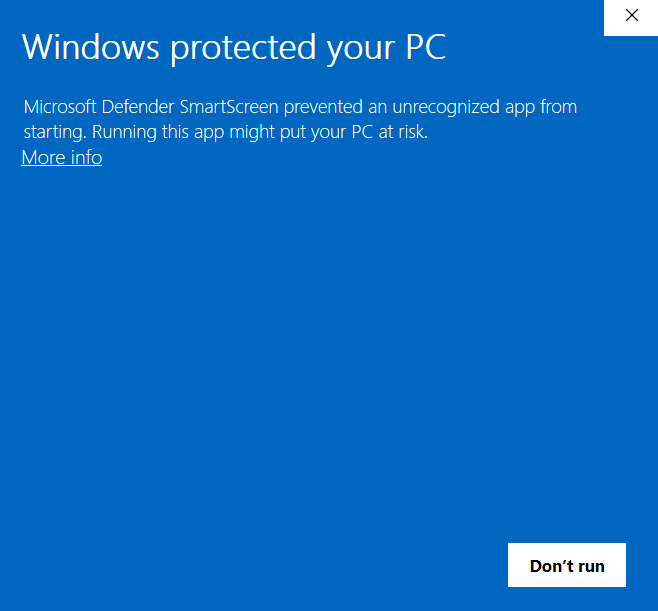
In this window, click “More Info.” Another button will appear at the bottom.
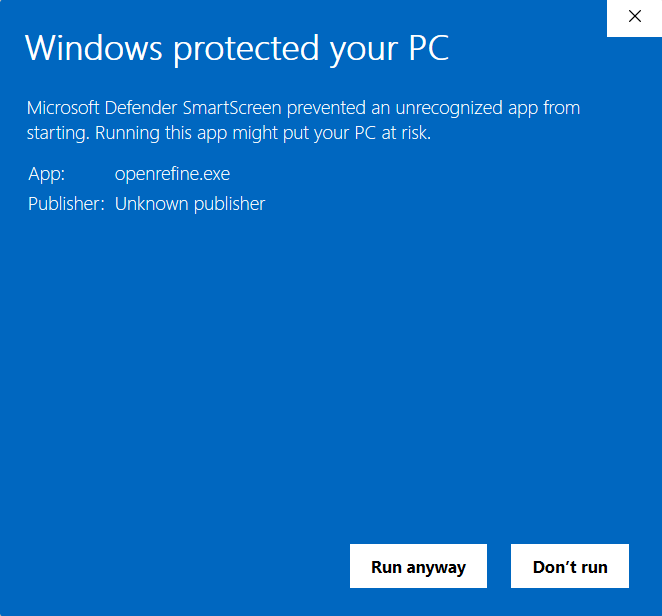
In this window, click “Run anyway” to open the screen below.
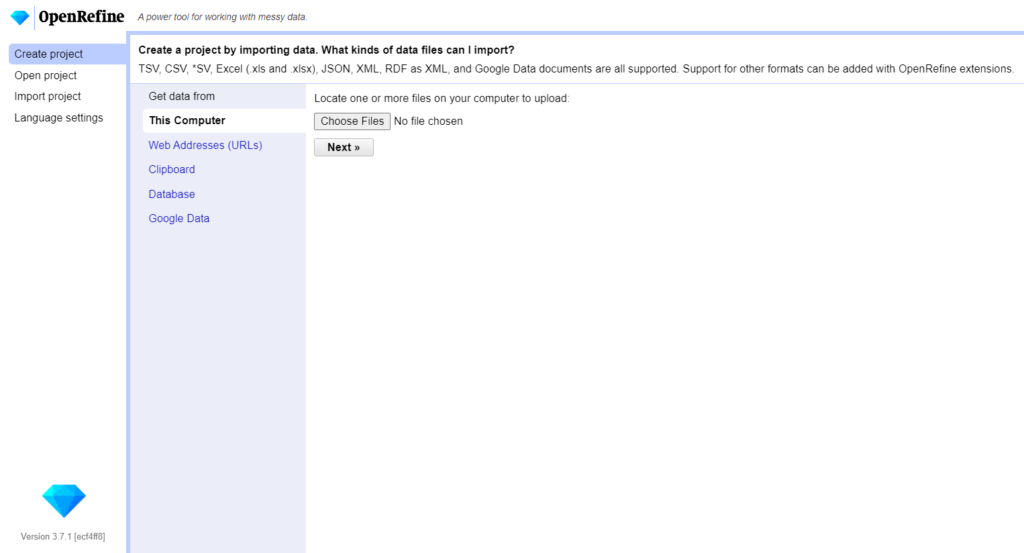
Congratulations! You have successfully opened OpenRefine and are ready for the workshop.
Introduction to Tidy Data Concepts & Materials
In this section we will discuss tidy data and the principles that undergird “useful” or “well-formatted” data, as well as the software that we will be using.
What is tidy/clean data?
Hadley Wickham, a statistician from New Zealand, wrote an article in 2014 in the Journal of Statistical Software that is now considered the basis for defining clean/tidy data. He notes the following:
Tidy datasets are easy to manipulate, model and visualize, and have a specific structure: each variable is a column, each observation is a row, and each type of observational unit is a table. This framework makes it easy to tidy messy datasets because only a small set of tools are needed to deal with a wide range of un-tidy datasets. This structure also makes it easier to develop tidy tools for data analysis, tools that both input and output tidy datasets. The advantages of a consistent data structure and matching tools are demonstrated with a case study free from mundane data manipulation chores.”
(Hadley Wickham, Tidy Data, Vol. 59, Issue 10, Sep 2014, Journal of Statistical Software. http://www.jstatsoft.org/v59/i10.)
As people who work with data day-to-day, what does this mean for us? Well, we often use spreadsheets to provide structure to data. “Tidy” data involves spreadsheets configured along a certain set of principles so that it is easiest to work with this data. So, what are these principles? Dr. Katie Walden, Professor of American Studies at Notre Dame, summarizes these principles and provides more specifics in her lab on OpenRefine:
- Be consistent
- Use consistent codes for categorical variables
- Use a consistent fixed code for any missing values
- Use consistent variable names
- Use consistent subject identifiers
- Use a consistent data layout in multiple files
- Use consistent file names
- Use a consistent format for all dates
- Use consistent phrases in your notes
- Be careful about extra spaces within cells
- Choose good names
- Avoid spaces
- Avoid special characters
- Be short but meaningful
- Write dates as YYYY-MM-DD
- Or have separate columns for YEAR, MONTH, DATE
- No empty cells
- Put just one thing in a cell
- Make it a rectangle
- Single first row with variable names
- Create a data dictionary
- You might also find this information in a codebook that goes with a dataset
- Things to include:
- The exact variable name as in the data file
- A version of the variable name that might be used in data visualizations
- A longer explanation of what the variable means
- The measurement units
- Expected minimum and maximum values
- No calculations in the raw data files
- Do not use font color/highlight as data
- Make backups
- Multiple locations (OneDrive, local computer, etc.)
- Version control program (i.e. Git)
- Write protect the file when not entering data
- Use data validation to avoid errors
- Save a copy of the data in plain text files
- File formats can include comma-separated values (CSV) or plain-text (TXT)
Additionally, the Carpentries lab notes some common errors in spreadsheets:
- Multiple tables
- Multiple tabs
- Not filling in zeros
- Using bad null values
- Using formatting to convey information
- Using formatting to make the data sheet look pretty
- Placing comments or units in cells
- More than one piece of information in a cell
- Field name problems
- Special characters in data
- Inclusion of metadata in data table
- Date formatting
At this point, you may still be wondering what tidy data looks like. This will likely become much more clear in our lab component of this workshop. But first, let’s learn a bit about the software we will be using.
What is OpenRefine?
According to their website, OpenRefine is a “powerful free, open source tool for working with messy data: cleaning it, transforming it from one format into another; and extending it with web services and external data. The Carpentries introduction to OpenRefine explains that the tool is “most useful where you have data in a simple tabular format such as a spreadsheet, a comma separated values file (csv) or a tab delimited file (tsv) but with internal inconsistencies either in data formats, or where data appears, or in terminology used” as it can be used to more easily standardize your data and give quick insights. Enough discussion about it though, let’s get started!
Lab Activity
In pairs or small groups, follow the sequence of the lab below. Instructors will be available for assistance. Or, if the group prefers, we can conduct a live data cleaning session together.
1. Ensure that you have a CSV of the following dataset somewhere on your computer.
2. Open OpenRefine on your computer. See the instructions above in the Pre-Workshop and Required Materials section.
3. Once you have OpenRefine in front of you, click the button “Choose Files”. A popup window will appear. Navigate to wherever the Measuring Impact dataset is located on your computer; click the file and then click “Open”. Once this is complete, you should see the file name next to the “Choose Files” button, like this:
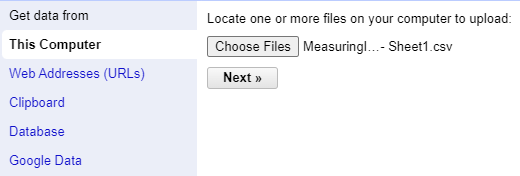
4. Click “Next”. Once uploaded, the data will open on a new screen with several options. Ensure that the option “Parse next 1 line(s) as column headers” is selected. Check also that the “Parse cell text into numbers, dates,…” option is not selected.
5. On the top right corner of the screen, there will be a box with the label “Project Name”. Go ahead and give this workshop a name.
6. Click the top rightmost button on the screen, called “Create Project >>”. This may take a moment.
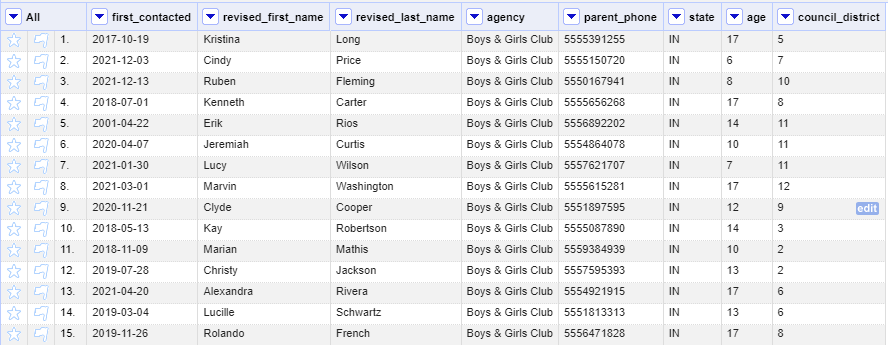
7. Once the data loads, the program will likely default to only display the first 5 records – don’t worry, they didn’t get deleted! Above your data, click to display 1000 rows so we can see more of our data. We have a total of 600 records, which is far too many to go through manually! Your screen should look something like the one below:
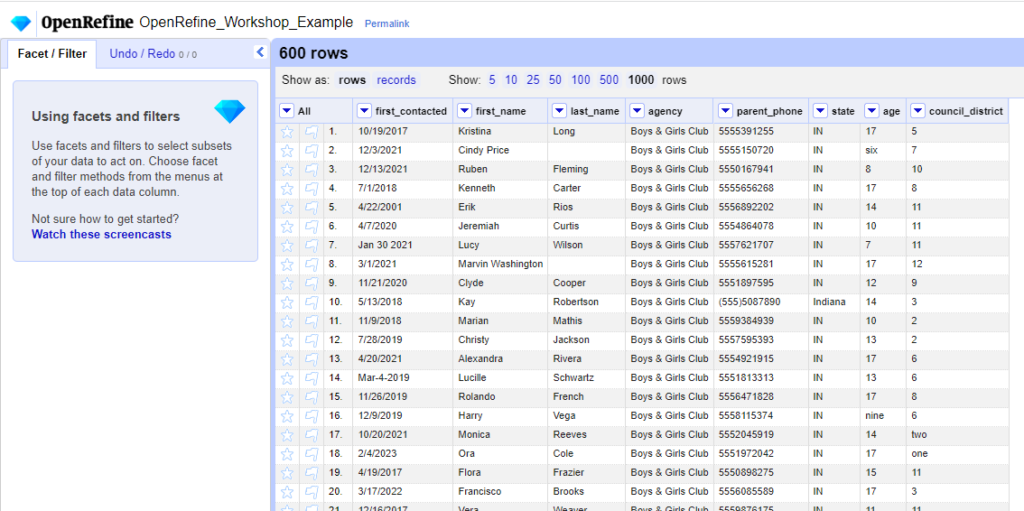
Note that the window to the left notes information about facets and filters. This includes additional resources, such as screencasts, that can supplement the information provided in this workshop.
8. Now that the data is open, take a moment to scroll through. With your partner or small group, discuss where you believe there are inconsistencies throughout this dataset and what may not be clean about this dataset, given the information discussed in the previous segment of the workshop.
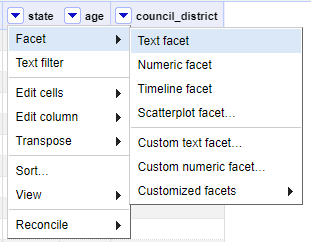
9. In OpenRefine, data is listed in a tabular format. They also have “facets” which are meant to help easily gather information about the data and ensure it is clean and consistent. According to the Library Carpentry’s Introduction to OpenRefine, “a facet groups all the values that appear in a column, and then allows you to filter the data by these values and edit values across many records at the same time”. Let’s practice by making a text facet. Click the dropdown arrow next to the “state” column. Navigate to Facet > Text facet.
10. As soon as you click this, a window will appear to the left side of your screen that shows the facet, essentially demonstrating all the unique values in that column.
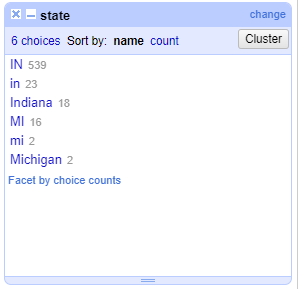
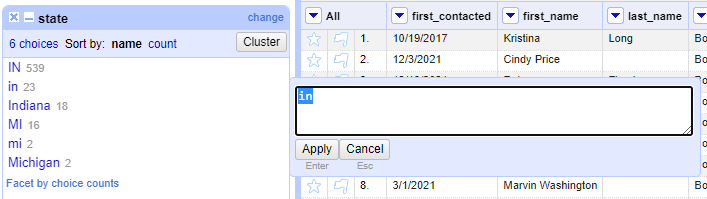
11. Notice when you hover over these values, two options appear: Include and Edit. Include can be used to select multiple values, while Edit can be used to make edits to all values and ensure the data is consistent. As you have likely already noticed, we do not have consistent data; there are capitalization issues, and some people listed the entire state name as opposed to just the two-letter abbreviation. Here, we just want to have the two-letter abbreviations in capital letters. Let’s start with the values “in”. The grey number next to this entry indicates that there are 23 occurrences throughout our dataset. Hover over this value and click “Edit”. A box will appear for you to change this value. Change it to “IN” and click “Apply”.
12. After doing this, we get a message at the top of the screen, noting that we made a mass edit:

And, note that the “state” facet no longer includes the value “in”, meaning we successfully changed all these values to be consistent with “IN”. Go ahead and edit the rest of these values so they are consistent with IN or MI.
13. Now that you are familiar with how to use text facets, repeat the process with the age and council_district columns, ensuring that only numerical values remain.
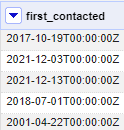
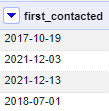
14. Still, we have some issues that require correction, namely in the first_contacted column, having both first and last names in the first_name column, and inconsistent parent_phone numbers. These issues are a bit more complex to fix. Of course, you can always repeat the same process and manually change each value, but for something like a date, this is not always the easiest way to clean your data. Let’s start with the first_contacted column. Click the dropdown and go to Edit cells > Common Transforms and select “To Date”.
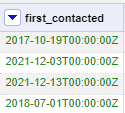
Our column immediately transforms the data into an ISO 8601 date format!
15. Unfortunately, we don’t have associated times with our dataset though. We could leave this the way it is, but if we just wanted to keep the date itself, we could make a few edits. First, we need to convert this column back into text so we can cut off the part that we want to keep. Thankfully, OpenRefine will still keep all of our corrected dates so we don’t have miscellaneous text! Click the dropdown button next to first_contacted again and go to Edit Cells > Common Transforms > To Text. This will turn the color of the dates black again.
The reason we must do this is because we can only take subsections of text, not dates.
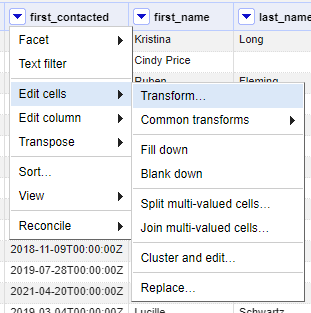
16. Next, we want to select the arrow by first_contacted again, and this time navigate to Edit Cells > Transform.
17. Once we do this, a popup window will appear. In this window, select “Python / Jython” in the Language dropdown, and enter the following code:
value = value[0:10]
return value
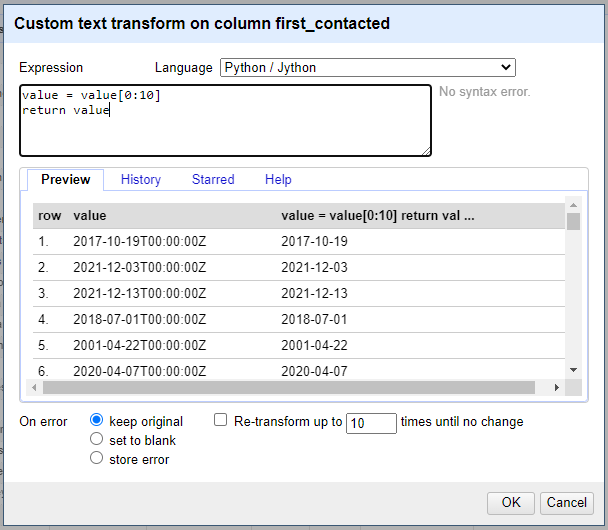
Because all of the dates are now the same length since being put into ISO 8601 format, we can just tell OpenRefine that we want to take the first 10 characters and get rid of the timestamp. From here, press OK. Our values are now just plain dates!
Again, we could go through manually as well, but this saves us much more time.
18. Next, let’s tackle the parent_phone column. There are several varieties of the way that people typed in their phone numbers, including parenthesis, hyphens, and periods. For our purposes, we only want the number without any special characters. Let’s start by opening the dropdown by parent_phone and navigating to Edit Cells > Transform again.
19. Ensure again that the Language is set to Python / Jython. Then, input the following code:
value = value.replace("(","").replace(")","").replace("-", "").replace(".", "")
return value
While this may look like a lot of nonsense characters, OpenRefine interprets it as removing the values ( ) – and . and replacing them with nothing, meaning it simply deletes them and returns the new value, which is the phone number with only numerical information.
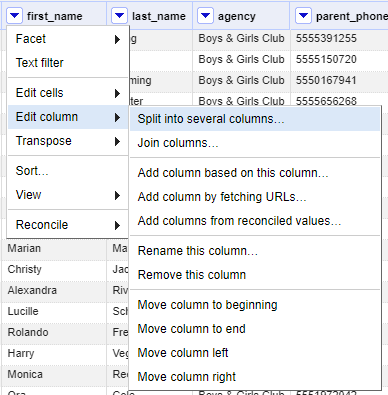
20. Our last issue is that there are several individuals whose last name is in the first_name category along with their first name, instead of being consistently two separate columns. To address this, let’s click the dropdown under first_name and go to Edit column > Split into several columns.
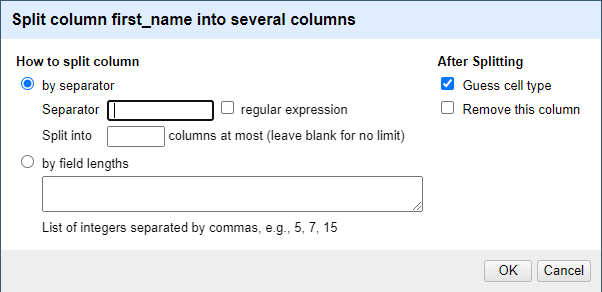
21. A popup will appear. Ensure that “by separator” is selected, and in the Separator box, enter one single space. Ensure that the box “Remove this column” is not checked so we can ensure we have the right data after doing this. Press OK.
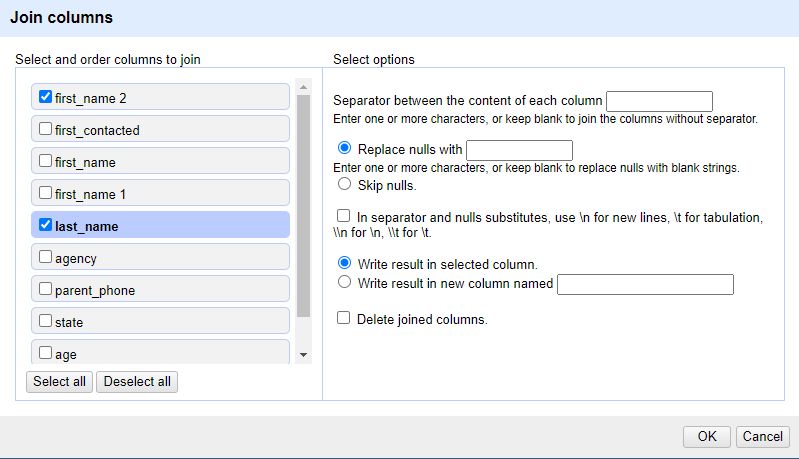
22. After doing this, what do you notice? Our first names are neatly separated, but our last_name and new column, first_name 2 are separated! We need to merge these two columns together so that they show as one cohesive column. Click the dropdown for first_name 2 and select Edit column > Join columns.
23. A popup window will appear again. On the left side, ensure that first_name 2 and last_name are selected. Nothing else should be changed from the default, and press OK.
24. Now we’ve got our data separated neatly, but there are many repetitive columns!

Let’s fix this by deleting the columns we don’t need and renaming the correct ones.
Click the dropdown for first_name, our original column with errors, and select Edit column > Remove this column. Then, we will do the same for last_name, which was originally missing some data.
25. After we do this, we have correct and clean data, so we can rename our columns as revised_first_name and revised_last_name by clicking the dropdown arrow next to the name of the column and navigating to Edit column > Rename this column. Our data is now clean and ready to go!
….Or is it?
Scroll down towards the bottom of the dataset. Can you spot the error that still exists?
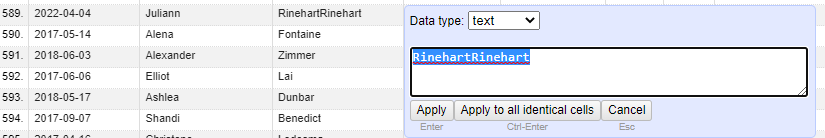
26. In row 589, Juliann Rinehart’s last name is duplicated, because it was typed into the original first_name and last_name columns. To fix this, we can hover over the cell and click the Edit button and adjust the name to Rinehart.
This just goes to show that it is worth checking your data for additional errors, even if you think you caught everything. And, it proves to us that data involves decision-making; forms and data are not necessarily always clean, but we often must decide how to represent what we believe to be correct based on the context.
27. Now, we are ready to export our clean data! Head over to the Export button on the upper right side of the screen and select your desired format, likely either Excel or Comma-separated value. Your project will save into your Downloads folder and it is ready to build visualizations with or to share! Below is a link to the cleaned data if you would like to compare your own data.
Closing Discussion
OpenRefine may be very new, and often, learning a new skill or software takes time. Still, compare this process to the time it would have likely taken to individually comb through the data and correct every mistake individually! While we covered some techniques that require a little bit of background in Python, this is meant to serve as a gateway to explore OpenRefine. In the first few examples of the lab, we see that not everything in OpenRefine requires a background in coding. As we come back together, we invite you to share any reflections with the larger group:
- How does OpenRefine compare to your past methods of cleaning data?
- Are there any particular aspects of OpenRefine that would be especially useful to you in your role?
- Based on the previous workshop in this series, is there a way that we might avoid having to do all this data cleaning in the first place?
We know that learning new software often is frustrating and a very gradual process, but you’ve reached the end of this workshop! We’d like to thank you for your patience and participation with us in this journey!
Congratulations on completing this workshop! Please consider giving us feedback in our survey linked in the button below so that we can continue to improve our workshops.