

Post by Andria Dawson, Post-Doc at the University of Arizona and the University of California-Berkeley
Fossil pollen counts from sediments collected from bogs, lakes, or forest hollows tell us something about the composition of surrounding forests (read more about fossil pollen here and here). In a sediment core, pollen samples from multiple depths tell us about changes in these surrounding forests over time. Barring some rare and complex geophysical events, going deeper means going back in time. With some simplifying assumptions about how pollen travels from tree to sediment we can use counts of sediment pollen grains to quantitatively reconstruct forests of the past.
However, correlating depth with time, or aging the sediment, is a difficult problem. Sediment accumulates at rates that vary through time, resulting in non-linear age-depth relationships. This means that knowing the sampling year – or the age of the surface sediment – is not enough to reliably estimate the ages of samples from further down in the sediment. This lack of information is solved with radiometric dating. Small pieces of plant material from the surrounding environment find their way into the sediment; these are macrofossils. Isotope signatures from these macrofossils can be used to determine their approximate age, and provide us with additional age-depth data points. Age-depth models can be constructed from these age-depth data points.
Another way to link depth with age is to look for signatory changes in pollen representation over time. Hallmark changes in the representation of indicator taxa allow scientists to associate sediment depths with events whose dates (ages) are roughly known. In the upper midwestern US, European settlement led to significant land-use changes which resulted in increases in several agricultural indicator taxa, including ambrosia (i.e., ragweed) and rumex (i.e., docks and sorrels) (Figure 1). This change in pollen representation makes it possible to identify pre- and post-settlement depths in a pollen sediment core. This matters because some scientists (including some of us on PalEON) hypothesize that major land-use changes probably caused big changes in the pollen-vegetation relationship. Were these anthropogenically-induced changes in the pollen-vegetation relationship greater than what we would expect without this external forcing? We don’t know, and might never know.
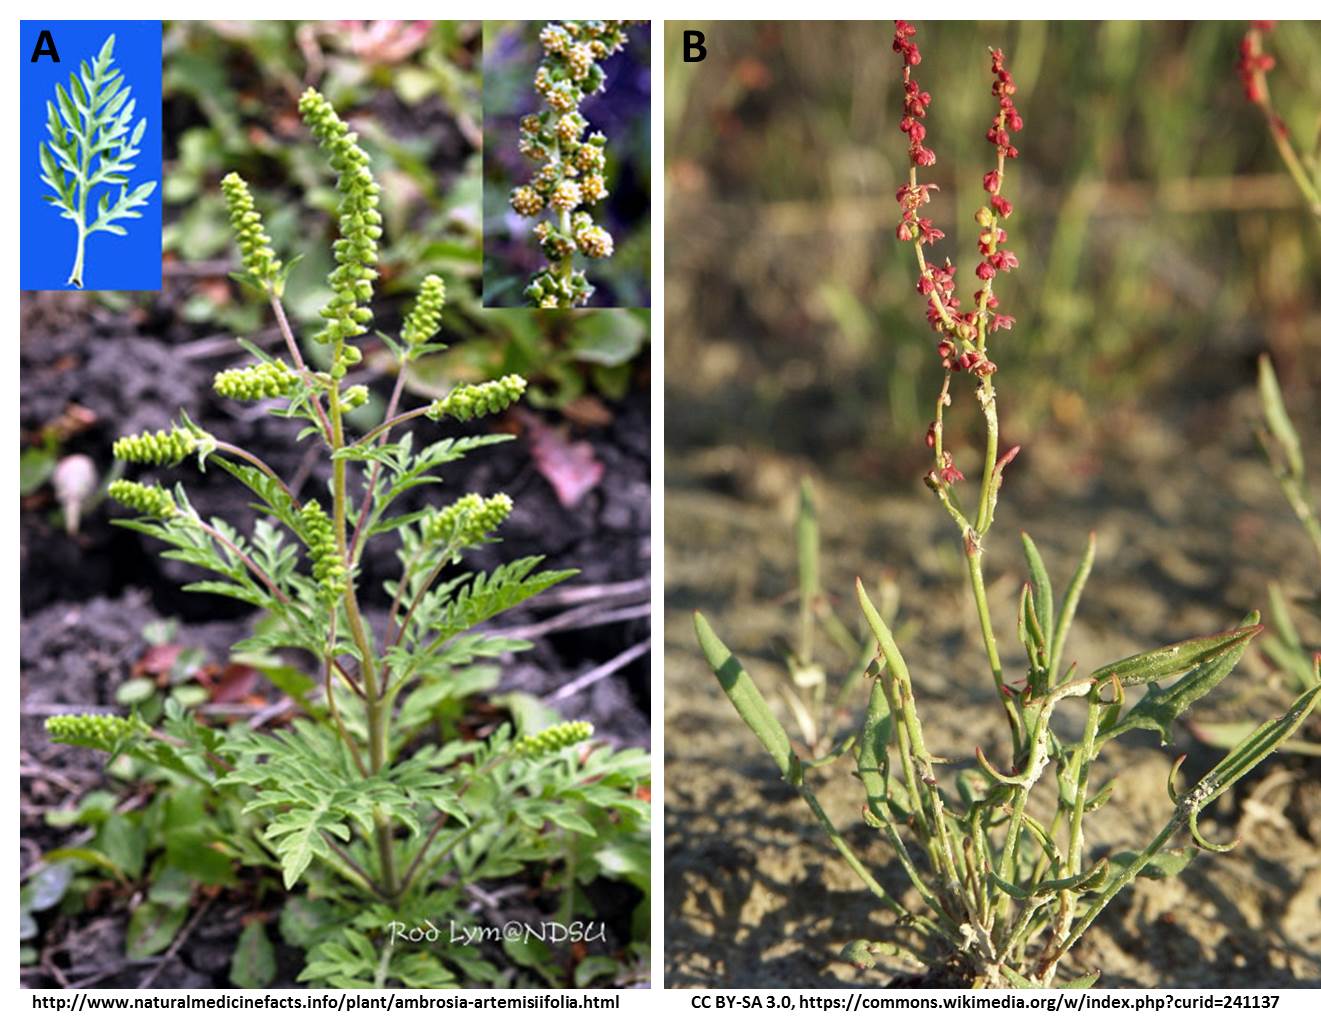
Images of A) ragweed and B) sheep sorrel.
Nevertheless, we want to identify what we often refer to as the settlement horizon in the pollen records for at least two reasons. First, it allows us to compare pollen from the time of European settlement with public land survey records. Second, it is often used as an additional age-depth data point in the construction of age-depth models. But how easy is it to identify this settlement horizon? Recent work shows it is not as easy as one might have thought.
The unofficial PalEON mantra is that it is better to be correct and uncertain than certain and wrong. This line of thought led us to conduct an experiment using expert elicitation, where experts were tasked with identifying the settlement horizon in pollen records from the upper midwest. Four experts each considered 185 pollen records from the upper midwest USA. For 59 pollen records the experts agreed on the location of the settlement horizon (Figure 2). For the remaining records, there was some level of disagreement (Figure 3). This is not surprising, but does highlight the importance of thinking about uncertainty. Does this mean that we should disregard all previous attempts to identify the settlement horizon? The answer to this is a resounding no. The moral from all of this is that understanding your data is critical; understand its uncertainty and how this impacts your work. In the age of big-data and data-sharing, it becomes more difficult to really know your data, but the payoff is sound science. Know your data, and know it well.
To learn more about how we use results from the expert elicitation exercise referred to above, check out our recent Dawson et al. 2016 paper in Quaternary Science Reviews where we calibrate the pollen-vegetation relationship. Elicitation results have also been used to redefine controls for a new suite of age-depth models (Goring et al., in prep), which will in turn be used to assign dates to pollen samples used in vegetation reconstructions (Dawson et al, in prep).
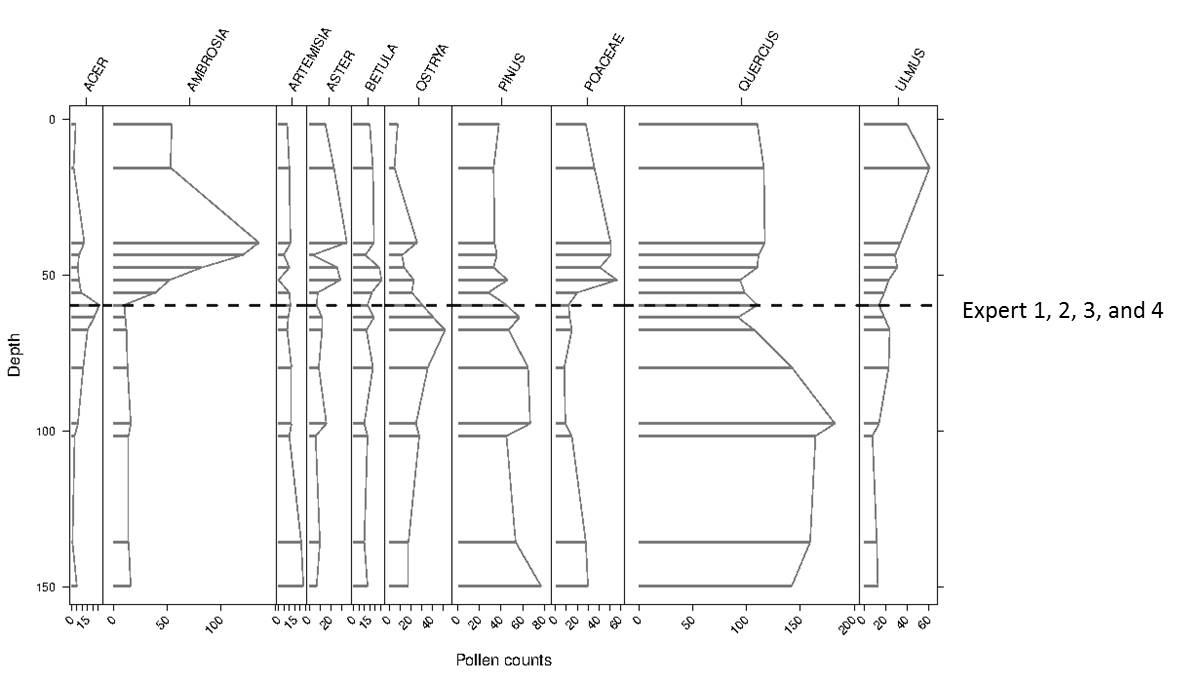
Figure 2. Example of a pollen diagram from a site where experts were in complete agreement on the location of the representative pre-settlement sample. Samples identified by experts as pre-settlement are indicated by the dashed lines.
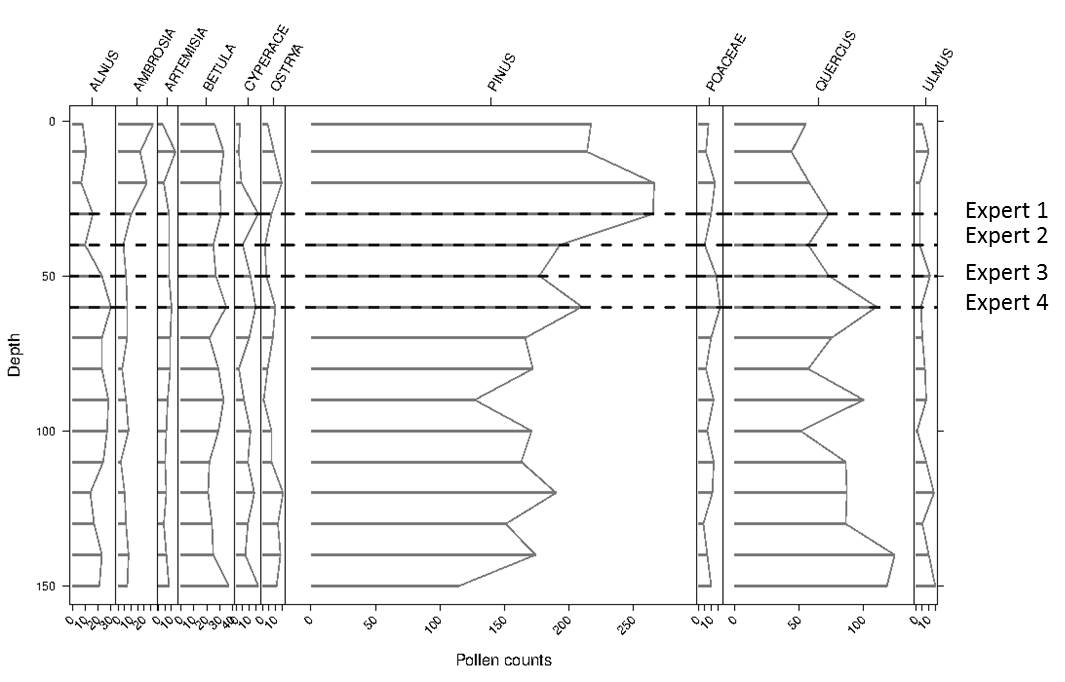
Figure 3. Example of a pollen diagram from a site where experts were in complete disagreement on the location of the representative pre-settlement sample. Samples identified by experts as pre-settlement are indicated by the dashed lines.
References
- Dawson, Paciorek, McLachlan, Goring, Williams, Jackson. 2016. Quantifying pollen-vegetation relationships to reconstruct ancient forests using 19th-century forest composition and pollen data. Quaternary Science Reviews.137: 156-175.
- Goring, Dawson, Grimm, et al. Semi-automated age model development for large scale databases. 2016. In prep for submission to Open Quaternary.
- Dawson, Paciorek, McLachlan, Goring, Williams, Jackson. 2016. Pre-industrial baseline variation of upper midwestern US vegetation. In prep for submission to Quaternary Science Reviews.