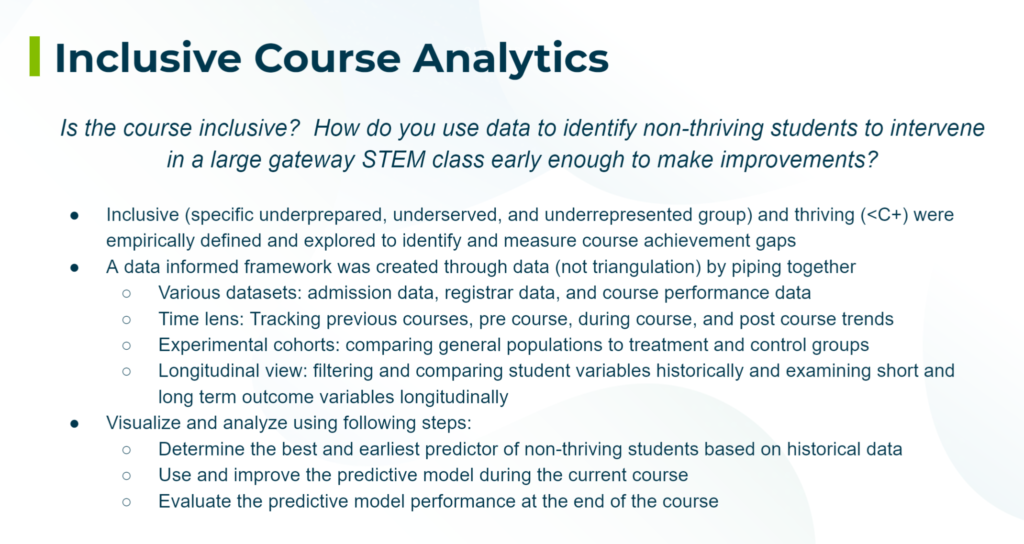
Description: We present an inclusive learning analytics framework for identifying at-risk or rather “non-thriving” students in a large-enrollment introductory general chemistry course. With the overall goals of closing opportunity gaps, maximizing all students’ potential for course success, and increasing STEM retention rates, our study used a hybrid approach of combining predictive modeling and domain experts decision-making to identify underperforming students during the early part of the course. We recognize that different institutions will have different definitions of thriving and course structures, but the methods we used in our study provide scholar-practitioners with a set of tools that can be replicated and customized for STEM courses on their campus.
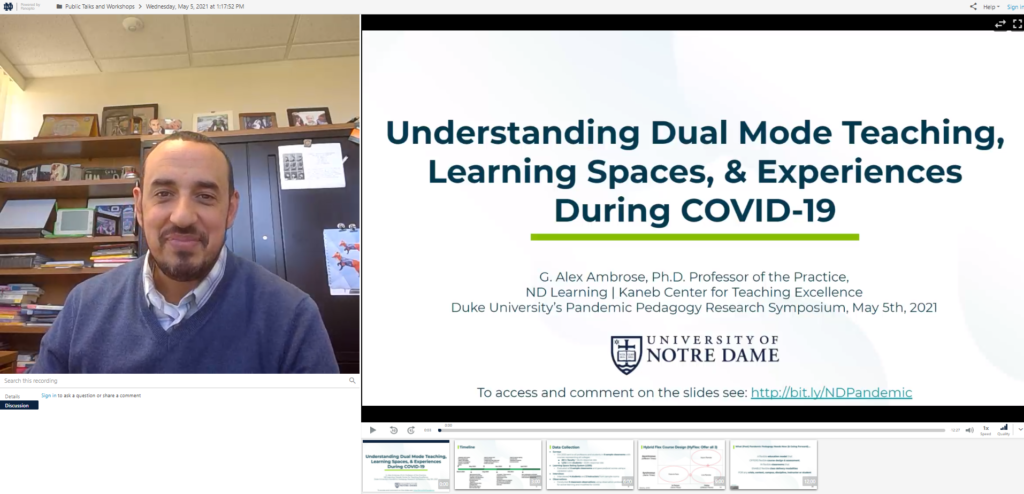
Check here for the 12 min recording of the presentation
To access and comment on the slide deck, click here
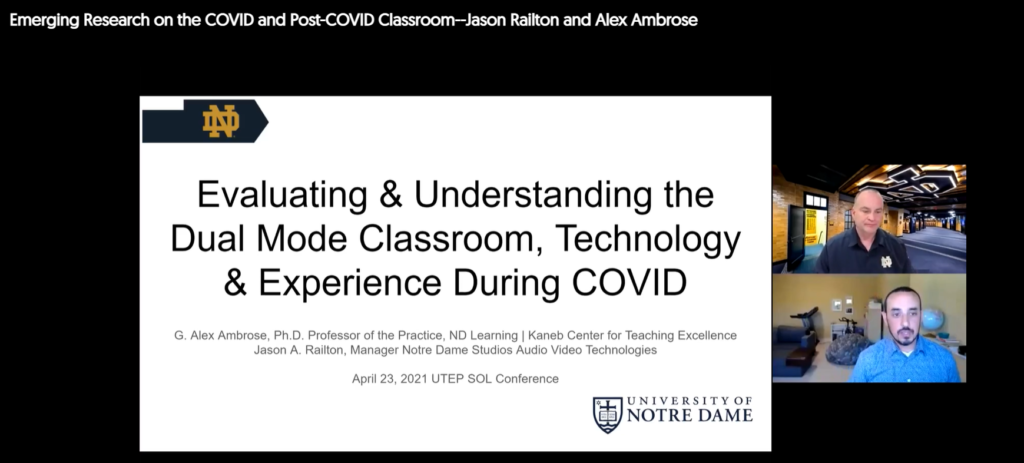
Abstract: This session will share COVID dual-mode (live in-person and remote classrooms) technology-enhanced classroom, teaching, and learning experiences from the University of Notre Dame. Using survey data from over 2k students and about 30 instructors across 6 classrooms (small, medium, and large across all disciplines) we will share how our classroom upgrades performed during COVID and the implications for the future classroom post-COVID.
Research Question: RQ1 Evaluating Dual-Mode Classroom Design: How can we improve dual-mode (in-person + live remote) classrooms during COVID and for future semesters and optimize to increase flexibility?
RQ 2 Understanding Dual-Mode Experiences: How can the experience of instructors, in-person and remote learners be improved by changes to the classroom, and what are the implications for post-COVID?
Context: During the Fall 2020 Semester, the University of Notre Dame, like all universities, had to make adjustments to its classrooms and traditional models of teaching in order to accommodate learning in a world with COVID-19. When COVID hit in spring 2020, Notre Dame transitioned to completely online learning with no students on campus. For Fall 2020, Notre Dame adopted multiple modes of teaching for its classes, with some online, some in person, and some hybrid, with half the class attending in-person while the other half attended online. Every in-person class had the capacity to be dual-mode, with the professor and some students in-person while students who could not come to class attended live remotely. In order to allow for dual mode delivery, classrooms across campus were upgraded with new technology, including an extra computer monitor on the lectern for the instructor workstation, with new webcams and microphones. Six classrooms with 30 different courses from all major disciplines were studied. A total of 29 faculty and 1,215 students were surveyed with a small sample of interviews and observations.
Methods: We analyzed data from multiple methods including surveys, interviews, observations, and the Learning Space Rating Score.
Related Work: Staggs, Jessica, Ambrose, G. Alex (expected May 2021) “COVID-19’s Effects on Classrooms’ Learning Space Rating System Scores” [Upcoming Article and Infographic: http://bit.ly/lsrsCovidND]
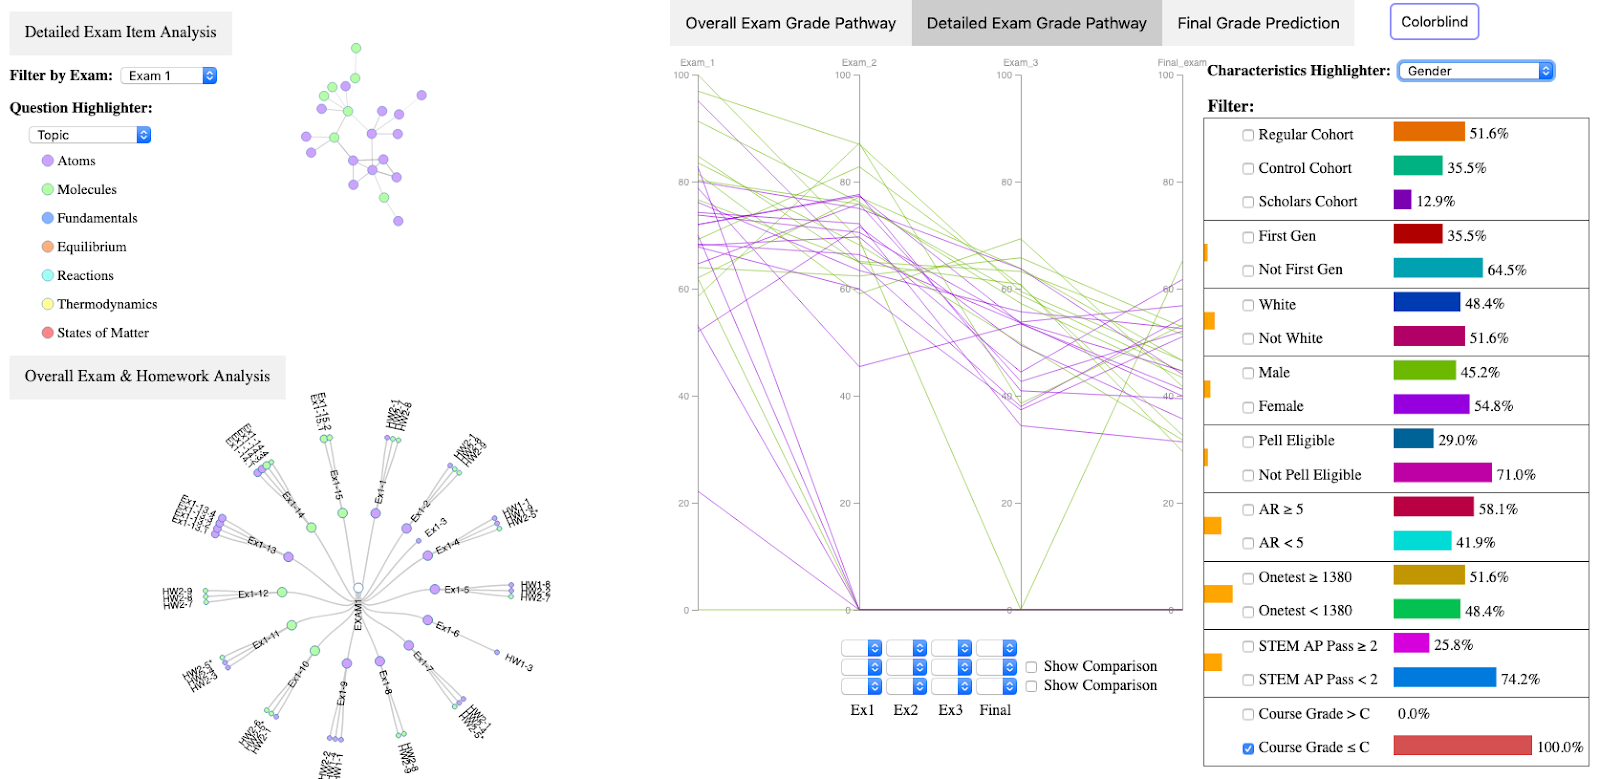
PerformanceVis is a visual analytics tool developed for analyzing and visualizing students’ chemistry course performance through the lens of time, homework and exams, and demographic and academic background. The Introduction to Chemical Principles course is a required course for all college of science and college of engineering programs at the university and is the second largest course on campus with approximately 1,000 freshmen taking the course.
This engaging tool includes four main views (overall exam grade pathway, detailed exam grade pathway, detailed exam item analysis, and overall exam & homework analysis) which are dynamically linked together for user interaction and exploration. PerformanceVis enables instructors to improve their course and assessment design by visualizing students’ perceived difficulty level and topic correlation between assignments and exams. It assists instructors and administrators in evaluating the impact of a special treatment program (cohort) by reviewing the performance of regular, control, and cohort students overall and by exam. The image below shows a screenshot of PerformanceVis with the right side of the image showing a view of the gender performance gap for those students who were not thriving. The left side of the image shows Exam 1 item analysis for each test question.
Abstract:
We present PerformanceVis, a visual analytics tool for analyzing student admission and course performance data and investigating homework and exam question design. Targeting a university-wide introductory chemistry course with nearly 1000 student enrollment, we consider the requirements and needs of students, instructors, and administrators in the design of PerformanceVis. We study the correlation between question items from assignments and exams, employ machine learning techniques for student grade prediction, and develop an interface for interactive exploration of student course performance data. PerformanceVis includes four main views (overall exam grade pathway, detailed exam grade pathway, detailed exam item analysis, and overall exam & homework analysis) which are dynamically linked together for user interaction and exploration. We demonstrate the effectiveness of PerformanceVis through case studies along with an ad-hoc expert evaluation. Finally, we conclude this work by pointing out future work in this direction of learning analytics research.
ABSTRACT: The challenge was to identify and help underserved and underprepared students in an introductory chemistry course to be retained and thrive in the college of science or engineering while supporting the general population. In this paper, we describe our methods for identifying these students, evaluating the impact of a special treatment program that was provided to a subset of those students, discuss our efforts to help the general population, and evaluate the short- and long-term impacts. In particular, we discuss a data-informed framework for analyzing student and outcome variables.
Short Abstract: The goal of this presentation is to share our data-informed approach to re-engineer the exam design, delivery, grading, and item analysis process in order to construct better exams that maximize all students potential to flourish. Can we make the use of exam analytics so easy and time efficient that faculty clearly see the benefit?