Duan, Xiaojing, Ambrose, G. Alex, Wang, Chaoli, Abbott, Kevin, Woodard, Victoria, Schalk, Catlin (2020) PerformanceVis: Homework & Exam Analytics Dashboard for Inclusive Student Success. Learning Analytics & Knowledge Conference. Practitioner Demo. Frankfurt, Germany
PerformanceVis is a visual analytics tool developed for analyzing and visualizing students’ chemistry course performance through the lens of time, homework and exams, and demographic and academic background. The Introduction to Chemical Principles course is a required course for all college of science and college of engineering programs at the university and is the second largest course on campus with approximately 1,000 freshmen taking the course.
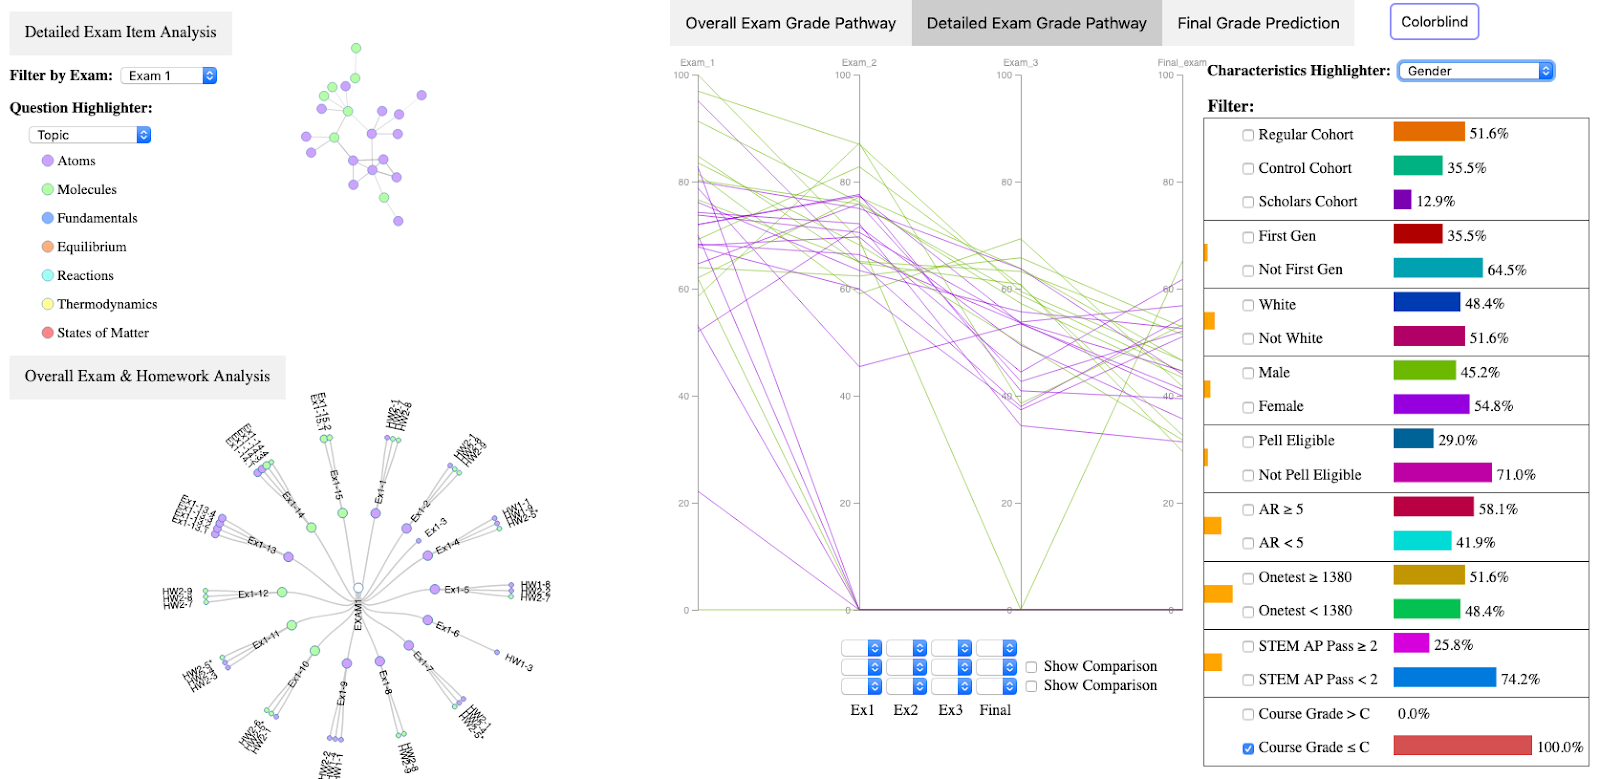
This engaging tool includes four main views (overall exam grade pathway, detailed exam grade pathway, detailed exam item analysis, and overall exam & homework analysis) which are dynamically linked together for user interaction and exploration. PerformanceVis enables instructors to improve their course and assessment design by visualizing students’ perceived difficulty level and topic correlation between assignments and exams. It assists instructors and administrators in evaluating the impact of a special treatment program (cohort) by reviewing the performance of regular, control, and cohort students overall and by exam. The image below shows a screenshot of PerformanceVis with the right side of the image showing a view of the gender performance gap for those students who were not thriving. The left side of the image shows Exam 1 item analysis for each test question.
Link to 5 min practitioner interactive demo on YouTube
Link to the Interactive Dashboard Tool: