1. What is a Data Flow Diagram?
- A Data Flow Diagram (DFD) is a visual representation of how data moves through a process or system. It depicts the flow of information between external entities, processes, and data stores.
- DFDs are widely used in system analysis and design to understand, refine, and document business processes.
2. Common Diagramming Symbols
- In Data Flow Diagrams (DFDs), the most common symbols are:
| Process: Circles or Rounded Rectangles indicate a function or activity that transforms inputs into outputs. | |
| Data Flow: Arrows represent the movement of data between entities, processes, and data stores. | |
| External Entity: Rectangles depict an external source or destination of data, such as a user, system, or organization outside the DFD scope. | |
| Data Store: Two Parallel Lines or Open-Ended Rectangles represent a repository where data is stored for later retrieval or processing. |
- These symbols follow the conventions of Gane & Sarson or Yourdon & DeMarco notation, which are the two most commonly used notations for DFDs.
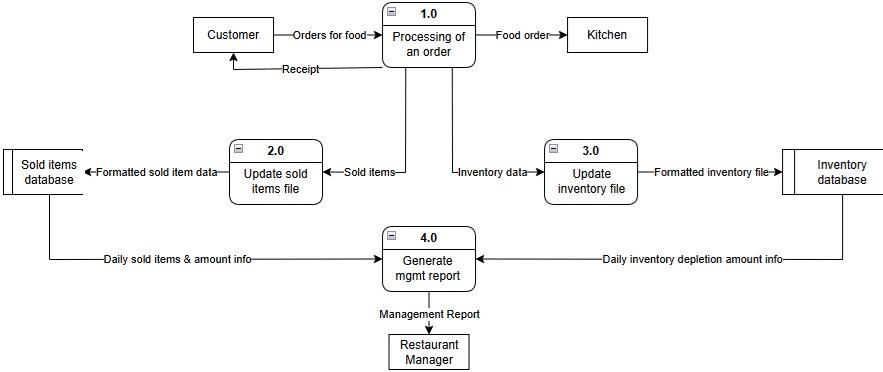
3. Example
- The example below visually represents how data flows between customers, the staff, and the system processes for a restaurant service.