1. What is a Process Flow Diagram?
- Process Flow Diagrams use common diagramming symbols (Start/End symbols, activities (rectangles), decision points (diamonds), and connectors) to illustrate the sequence of tasks and activities in a business process.
- They are typically used for process improvement, workflow automation, business transformation projects.
- This type of diagramming is often referred to as “process flowcharts” or “process maps”. Technically…
- A flowchart is a diagram that illustrates the sequence of steps in a process using standardized symbols such as rectangles (process steps), diamonds (decision points), and arrows (flow direction). They are are primarily used to:
- Show the step-by-step flow of activities.
- Aid in understanding and analyzing a specific process or algorithm.
- Help in troubleshooting, improving efficiency, or automating tasks.
- A process map is a diagram that provides a broader view of an entire business process, showing inputs, outputs, interactions, and dependencies. It focuses on understanding how different tasks and stakeholders interact to achieve a business goal. They are are primarily used to:
- Provide a big-picture view of a process.
- Help in process improvement, compliance, and efficiency analysis.
- Identify roles, responsibilities, bottlenecks, and value streams.
- However, these terms are typically used interchangeably from a practical/application standpoint.
- A flowchart is a diagram that illustrates the sequence of steps in a process using standardized symbols such as rectangles (process steps), diamonds (decision points), and arrows (flow direction). They are are primarily used to:
- The sections below describe some of the most common Process Flow Diagrams used.
A. High-Level Process Map
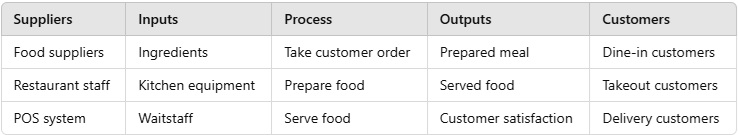
- A high-level process map, also known as a top-down map, value chain map or SIPOC (Suppliers, Inputs, Process, Outputs, Customers), provides a high-level overview of the key components of a process. Steps or items depicted are limited to the essentials of the process and the map includes minimal detail.
- These process maps are also useful for discussing processes with superiors or third parties who don’t need to know the specifics of the operation.
- Best for: Communicating the essential steps of a process.
B. Basic Flowchart
- The simplest form of a diagramming is a basic flowchart. The basic flowchart uses common diagramming symbols to illustrate the inputs and outputs of a process and the steps included in completing the process.
- Basic flowcharts can be used to plan new projects, improve communication between team members, model and document processes, solve problems in a current process, and analyze and manage workflows.
- Best for: Showing how a process is done from start to finish (without a lot of detail), typically in sequential order.
- Basic flowcharts can be used to plan new projects, improve communication between team members, model and document processes, solve problems in a current process, and analyze and manage workflows.

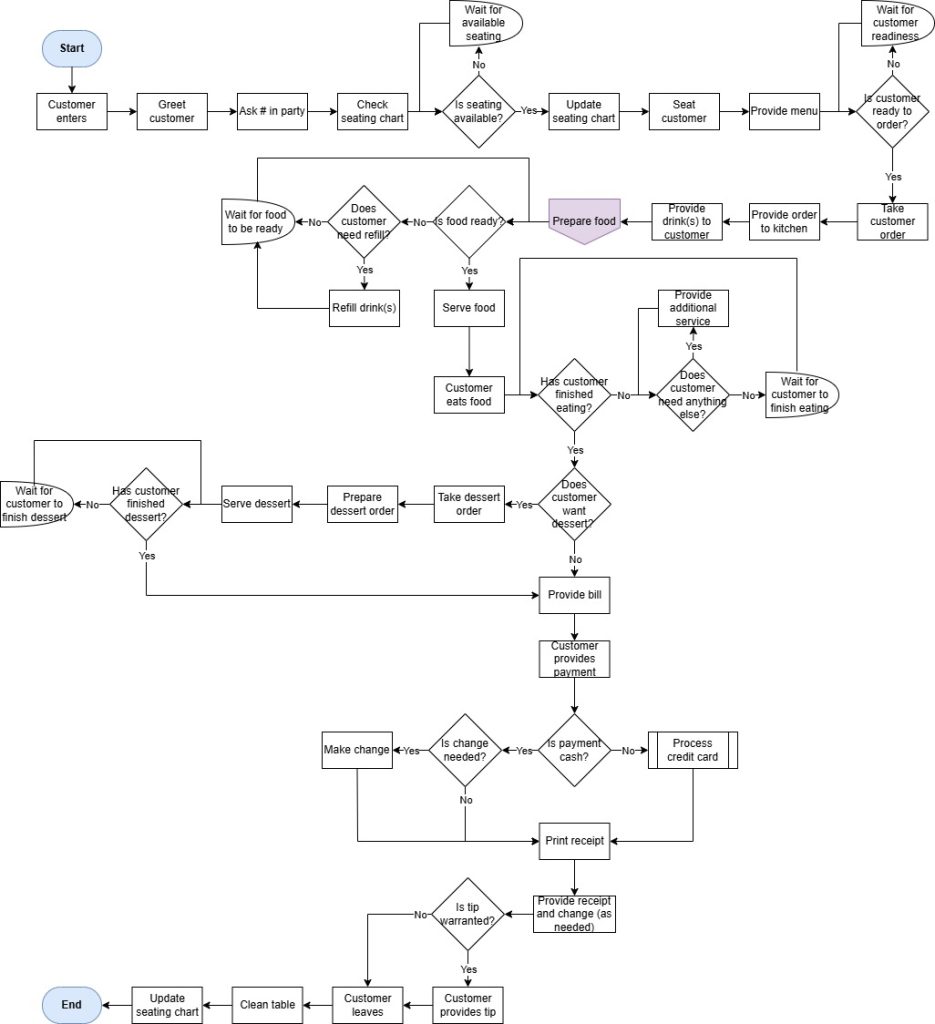
C. Detailed Process Flowchart
- In contrast with the high-level process map, a detailed process map provides all the details of each step and includes subprocesses. It documents decision points and the inputs and outputs of each step. This process map provides the most thorough understanding of the mapped process and is most effective in pinpointing areas of inefficiency due to its high level of detail.
- Best for: Providing a comprehensive understanding of a process, including all details and contingencies.
2. Common Diagramming Symbols
- Flow Diagramming uses symbols from the Unified Modeling Language (UML) to represent key elements on a diagram, such as steps, decision points, inputs and outputs, and participating team members.
- Here are the most common symbols and their usage:
 | Terminator: Ovals denote the beginning and end of the process. |
| Process step: A rectangle represents an activity or task in the process. | |
| Flow: Arrows connect steps in the process and show directional flow. | |
 | Decision: A diamond illustrates a point where a decision needs to be made, usually with “yes” or “no” options branching from this point. |
| Delay: A D-shaped symbol (rectangle with one end rounded) is often used as a delay symbol, showing a pause in the process before the flow continues. | |
 | Document: A rectangle with a wavy bottom line represents a document or information that people can read. Multiple documents are indicated by a symbol resembling multiple stacked wavy rectangles. |
 | Database: A cylinder signifies stored data on a storage device like a hard drive where information can be searched and filtered. |
| Automated Process or Subprocess: A rectangle with two lines on the left and right side represents an automated process or subroutine. | |
 | Off-Page Connector: A "home plate" symbol, which looks like a pentagon, indicates that the flow continues on another page of the flowchart; essentially marking a point where the process jumps to a different section. |
3. How to Create a Process Map
- You can customize process maps to match your needs and preferences, but there are also general tips to keep in mind when process mapping to maximize effectiveness. Here are a few process mapping best practices to apply as you get started:
- Plan your process map:
- Establish the boundaries of the process so that only necessary information is included.
- Set clear objectives for the process.
- Discuss the process with stakeholders. You could also watch the workers who perform the tasks demonstrate the process.
- Get the right people involved: Gather those who have deep knowledge of the process that you’re looking to optimize. These subject matter experts (SMEs) will help you determine the critical information within the entire process, such as roles, sequence of steps, timelines and resources. They can also highlight some of the problem areas, such as bottlenecks and redundancies, which might compromise efficiency. During this stage of the process, you want to document all relevant information around the process.
- Draft your process map:
- You might want to start by mapping the process in its current state, not necessarily a perfect or idealized state, and make improvements from there.
- Create the visual representation of the process using common flowchart symbols and standardized notation so everyone is on the same page
- Depict where the process starts and ends and the sequence of steps in between. While the level of detail can vary, information around inputs, outputs, metrics and stakeholders are typically included.
- Keep the process map simple. Include all necessary details, no more and no less.
- Consider creating a Notes section on the process map to contain additional information (e.g., data element lists, etc) and using reference notation within the steps
- If a process map becomes too large, it may be overwhelming and hard to follow. Consider breaking out sub processes into separate process maps and use Off-Page Connectors to keep the process map manageable.
- Get feedback on your process map:
- Review the process map with everyone involved in the process to get feedback and validation of accuracy.
- When stakeholders have agreed on the process steps within the current state, start to solicit feedback around potential process optimizations. This can involve the elimination of steps for simplification purposes or the incorporation of new ones.
- Plan your process map: