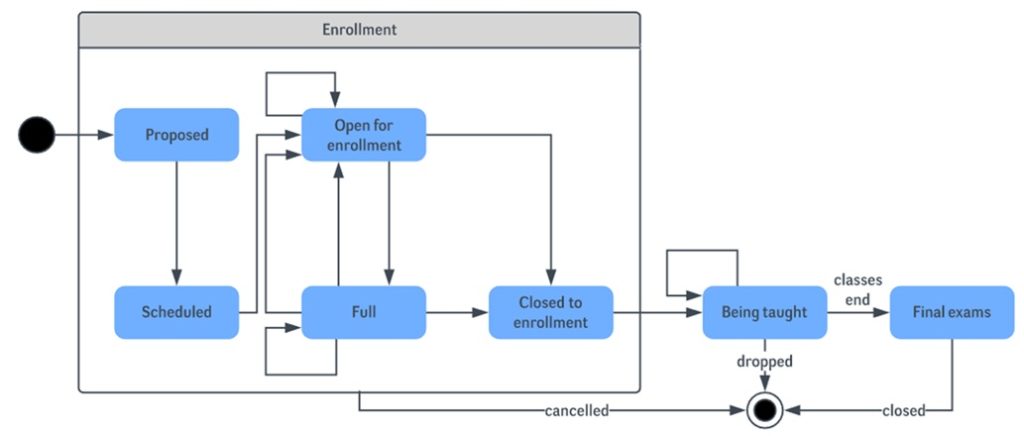
1. What is a State Diagram Diagram?
- A State Diagram is a graphical representation of how an object, system, or process transitions between different states based on events or conditions.
- It is commonly used in software engineering, system design, and finite state machines (FSMs) to model dynamic behavior of a lifecycle.
2. Common Diagramming Symbols
 | Initial State: A filled circle represents the starting point of the system when it is first activated. |
|---|---|
| State: Rounded rectangles depicts the different conditions or statuses an object can be in at a given time. | |
| Transition: Arrows show the movement from one state to another based on triggers or events. These are often labeled with the event triggering the transition. | |
 | Decision: Diamonds represent a decision point where the state machine can transition to different states based on conditions. |
 | Final State: A filled circle with an outer ring represents the termination or completion of a process. |
3. Example