October may very well be the most boring numbers month of the year. Most percentages didn’t change at all, and those that did were mostly by only 1%.
ND.edu

Traffic
- 1,245,106 views by 411,201 people
Browsers
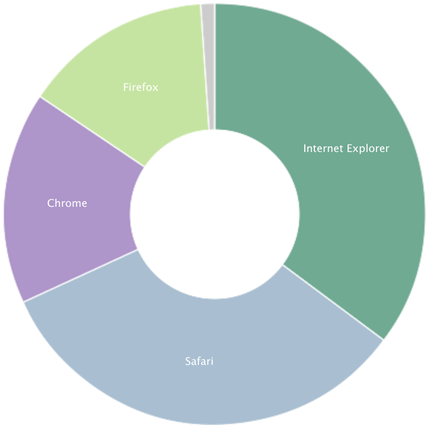
- IE 35%
- IE9 20%
- IE8 12%
- IE7 3%
- Safari 33%
- Chrome 16%
- Firefox 14%
Platforms (Overall)
- Windows 59%
- Mac 24%
- iOS 11%
- Android 4%
Mobile Traffic
- iOS 72%
- Android 25%
m.nd.edu

Traffic
- 81,157 views by 7,597 people
- Top Content
- Food
- Athletics
- Map
- Webcams
- Events
Platforms
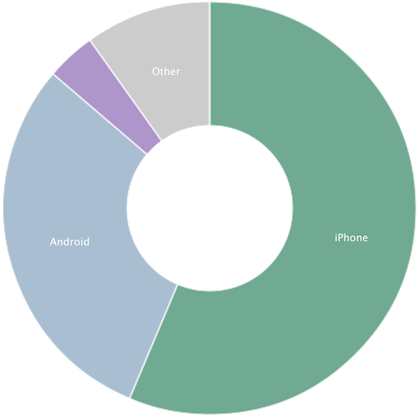
- iPhone 56%
- Android 30%
- Windows 4%
- iPod 3%
- BlackBerry 2%
- iPad 2%
Conductor

- 293 live sites (+8)
Traffic
- 3,955,973 views by 865,820 people
Browsers
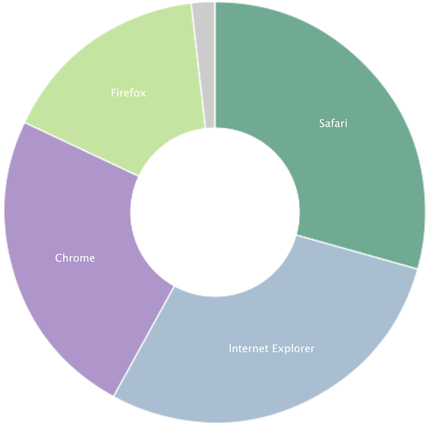
- Safari 29%
- IE 29%
- IE9 16%
- IE8 9%
- IE7 3%
- Chrome 24%
- Firefox 16%
Platforms
- Windows 58%
- Mac 27%
- iPhone 6%
- iPad 5%
- Android 3%
Stats are from Gaug.es by Github and Google Analytics.
Great stuff, Erik.