June 2015 web stats are now available.
ND.edu
Traffic
- 540,833 views by 175,204 people
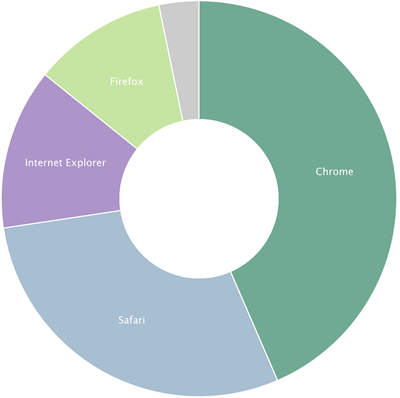
Browsers
- Chrome 42%
- Safari 25%
- IE 19%
- IE11 13%
- IE10 3%
- IE9 3%
- IE8 1%
- Firefox 11%
Platforms (Overall)
- Windows 57%
- Mac 21%
- iOS 14%
- Android 5%
Mobile Traffic
- Total 23%
- iOS 70%
- Android 23%
- Windows 6%
- Windows Phone 7.5 1%
- Blackberry 0.3%
m.nd.edu
Traffic
- 106,500 views by 7,593 people
Top Content (General)
- Map
- Athletics
- Dining
- Photos
- Webcams
Top Content (Students)
- Dining
- Map
- Academics
- Webcams
- Directory
Platforms
- iOS 78%
- Android 17%
- Macintosh 2%
- Windows 2%
Conductor
468 live sites (+12)
- Burke Golf Course
- University Health Services
- Economic Impact
- Julian Velasco
- OIT Annual Report 2014
- a view from the couch
- Climate Investing
- Early American Literature
- Welcome Weekend
- The Program in Arabic and Middle East Studies
- Department of Sociology
- Mendoza Marketing Communications
Traffic
- 3,258,832 views by 915,181 people
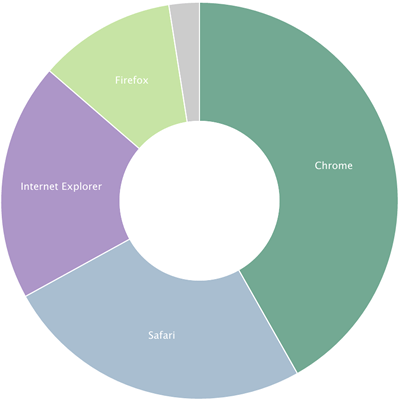
Browsers
- Chrome 43%
- Safari 29%
- IE 13%
- IE11 9%
- IE10 2%
- IE9 2%
- IE8 1%
- Firefox 11%
Platforms
- Windows 49%
- Mac 24%
- iPhone 13%
- Android 7%
- iPad 5%
Mobile Traffic
- Total 35% (+7%)
- iOS 70%
- Android 25%
- Windows 3%
- Windows Phone 0.7%
- Blackberry 0.4%
Stats are compiled from Gaug.es by Github and Google Analytics.