ND.edu
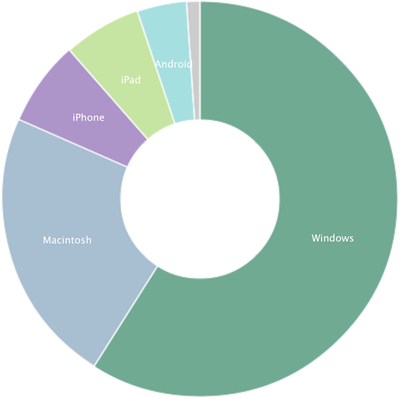
Mobile traffic on the ND homepage went from 9.11% last December to 10.6% in December 2013 while tablets increased from 5.1% to 6.5% in the same timeframe. Mobile + Tablet traffic for the whole year averaged to 13.03%. This year we saw IE8 drop from 9% to 5%, and IE9 dropped from 18% to 11%. Chrome grew by 8% to 26% total and Safari fell by 8% to 28% total.
m.ND.edu
It was pretty much business as usual on m.nd.edu with some very minor platform shifts.
January to December changes:
- iPhone 61% -> 64%
- Android 26% -> 24%
Conductor
Conductor finished the year with 368 live sites, an increase of 64.

Browsers
January to December changes:
- Safari 30% -> 29%
- Chrome 27% -> 35%
- Internet Explorer 24% -> 17%
- IE9 15% -> 6%
- IE8 7% -> 3%
- IE7 2% -> 1%
- IE10 1% -> 4%
- Firefox 16% -> 13%
Platforms
January to December changes:
- Windows 55% -> 52%
- Macintosh 28% -> 28%
- iOS 12% -> 15%
- Android 3% -> 4%
Overall Mobile/Tablet Stats
Since the BCS bowl game last January skewed our mobile stats to such a large degree, I’m including February stats in the following list to give a more realistic growth pattern. When February is taken into account, we see a pretty large increase overall for the year. Mobile/Tablet traffic changes:
January (February) -> December
- www.ND.edu 24.2% (10.9%) -> 17.2%
- Admissions 23.2% (18.2%) -> 27.7%
- Blogs 14% (18.9%) -> 26.1%
- Calendar 41.2% (39%) -> 58.3%
- Game Day 48.1% (32.5%) -> 54.5%
- News 42.6% (24.9%) -> 30.9%
- Magazine 38.1% (24.2%) -> 33.9%
- Supporting 17.5% (11.5%) -> 17.7%
- Tour 28.6% (23.1%) -> 30%
We’ll be back next month with our regularly schedule stats for January.