Data trends (increase and decreases) this month are for December 2013 and January 2014. This month we saw IE11 (released Nov 6,2013) appear out of nowhere and jump to 9% on www.nd.edu and 6% acoss all Conductor sites. This was coupled with a sharp drop in IE10 stats, but little change in IE9. Continue reading “January 2014 Stats”
Category: Statistics
2013 Stats Year in Review
ND.edu
Mobile traffic on the ND homepage went from 9.11% last December to 10.6% in December 2013 while tablets increased from 5.1% to 6.5% in the same timeframe. Mobile + Tablet traffic for the whole year averaged to 13.03%. This year we saw IE8 drop from 9% to 5%, and IE9 dropped from 18% to 11%. Chrome grew by 8% to 26% total and Safari fell by 8% to 28% total. Continue reading “2013 Stats Year in Review”
November 2013 Stats
If there’s additional stats you’d find helpful or interesting that are not included below, leave a comment and we’ll see about adding them in the future. Continue reading “November 2013 Stats”
October 2013 Stats
ND.edu
Traffic
- 1,035,524 views by 311,606 people
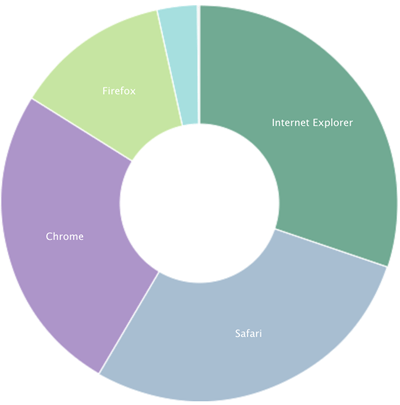
Browsers
- IE 30%
- IE9 13%
- IE10 11%
- IE8 5%
- IE7 1%
- Safari 28%
- Chrome 25%
- Firefox 13%
Platforms (Overall)
- Windows 59%
- Mac 24%
- iOS 12%
- Android 4%
Mobile Traffic
- Total 16%
- iOS 76%
- Android 22%
- Windows Phone 1%
- Blackberry 0.7%
m.nd.edu
Traffic
- 64,511 views by 7,457 people
- Top Content
- Food
- Athletics
- Map
- Webcams
- Events
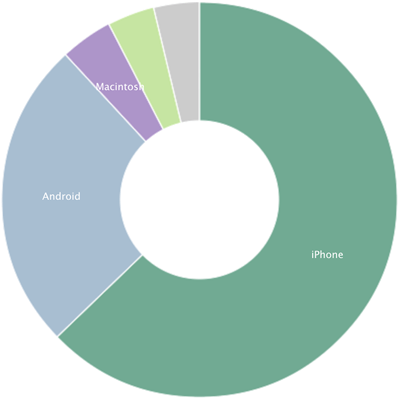
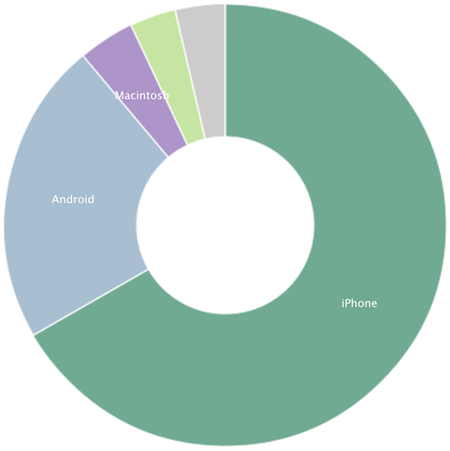
Platforms
- iPhone 63% (-4%)
- Android 25%
- Macintosh 4%
- Windows 4%
- iPad 2%
- iPod 1%
Conductor
- 353 live sites (+12)
Traffic
- 4,020,041 views by 1,010,786 people
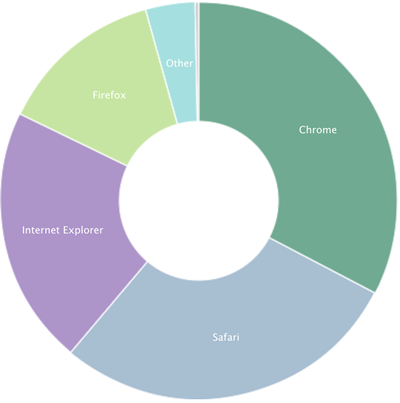
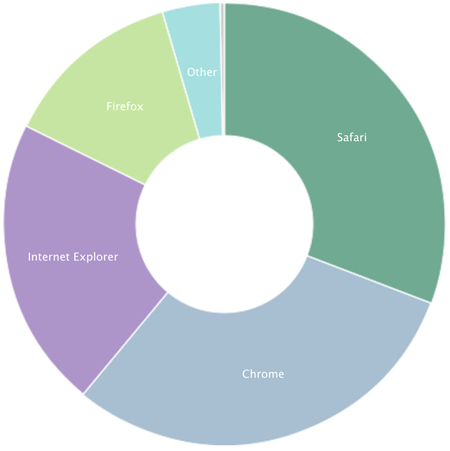
Browsers
- Chrome 33%
- Safari 28%
- IE 21%
- IE10 9%
- IE9 7%
- IE8 4%
- IE7 1%
- Firefox 13%
Platforms
- Windows 55%
- Mac 27%
- iPhone 8%
- iPad 5%
- Android 4%
Stats are compiled from Gaug.es by Github and Google Analytics.
September 2013 Stats
ND.edu
Traffic
- 1,053,954 views by 319,286 people
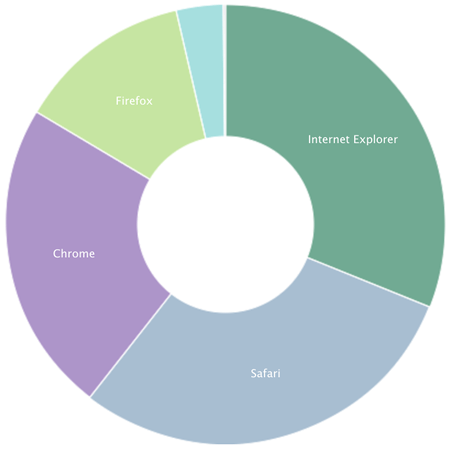
Browsers
- IE 31%
- IE9 13%
- IE10 11%
- IE8 5%
- IE7 1%
- Safari 29%
- Chrome 23%
- Firefox 13%
Platforms (Overall)
- Windows 58%
- Mac 24%
- iOS 13%
- Android 4%
Mobile Traffic
- Total 16%
- iOS 76% (+13%)
- Android 22% (+5%)
- Windows Phone 0.9%
- Blackberry 0.8%
m.nd.edu
Traffic
- 98,615 views by 8,103 people
- Top Content
- Food
- Map
- Athletics
- Academics
- Webcams
Platforms
- iPhone 67%
- Android 22%
- Macintosh 4%
- Windows 3%
- iPod 2%
- iPad 1%
Conductor
- 341 live sites (+1)
Traffic
- 3,986,152 views by 1,025,458 people
Browsers
- Safari 31%
- Chrome 30%
- IE 21%
- IE10 10%
- IE9 7%
- IE8 4%
- IE7 1%
- Firefox 13%
Platforms
- Windows 52%
- Mac 27% (+3%)
- iPhone 10%
- iPad 6%
- Android 4%
Stats are compiled from Gaug.es by Github and Google Analytics.