Once again we have a fairly boring month. The only notable change would be a 5% increase in iOS traffic on ND.edu. Tune in next month for a year-end analysis of changes and trends. Continue reading “November 2012 Stats”
Category: Statistics
October 2012 Stats
October may very well be the most boring numbers month of the year. Most percentages didn’t change at all, and those that did were mostly by only 1%.
ND.edu
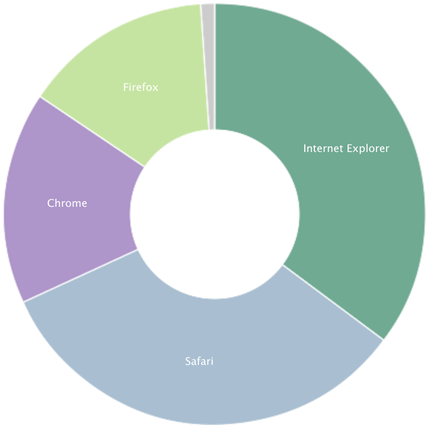
Traffic
- 1,245,106 views by 411,201 people
Browsers
- IE 35%
- IE9 20%
- IE8 12%
- IE7 3%
- Safari 33%
- Chrome 16%
- Firefox 14%
Platforms (Overall)
- Windows 59%
- Mac 24%
- iOS 11%
- Android 4%
Mobile Traffic
- iOS 72%
- Android 25%
m.nd.edu
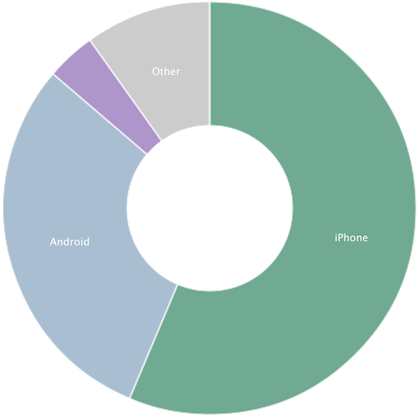
Traffic
- 81,157 views by 7,597 people
- Top Content
- Food
- Athletics
- Map
- Webcams
- Events
Platforms
- iPhone 56%
- Android 30%
- Windows 4%
- iPod 3%
- BlackBerry 2%
- iPad 2%
Conductor
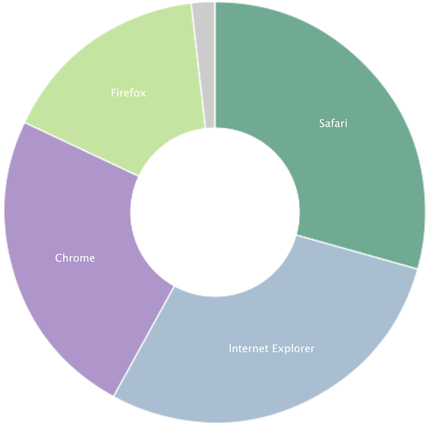
- 293 live sites (+8)
Traffic
- 3,955,973 views by 865,820 people
Browsers
- Safari 29%
- IE 29%
- IE9 16%
- IE8 9%
- IE7 3%
- Chrome 24%
- Firefox 16%
Platforms
- Windows 58%
- Mac 27%
- iPhone 6%
- iPad 5%
- Android 3%
Stats are from Gaug.es by Github and Google Analytics.
August 2012 Stats
August stats greet us with the return of students to campus (August 21 was the first day of classes) and with them their mobile devices. And in this years case, it appears to be iPhone’s. The mobile site saw an increase of 16% for iPhone’s in August and a 13% drop in Windows mobile.
Update: I pulled the graph for the ND.edu browser stats. We conducted a load test last month which has been adjusted in the numbers, but the graph was not accurate. Sorry for the confusion. Continue reading “August 2012 Stats”
July 2012 Stats
July was a fairly quiet month with one exception. The Windows platform on m.nd.edu went up 9% for a total of 18% traffic. Last month it climbed 4%. That’s not a shabby two month increase for our friends in Redmond.
ND.edu
Traffic
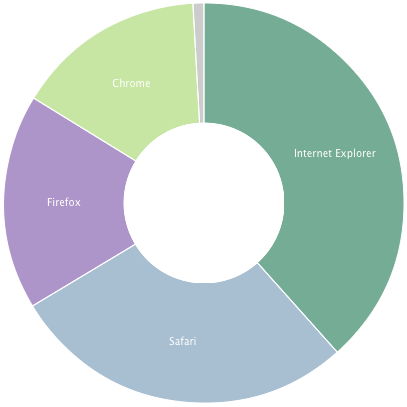
- 721,733 views by 203,814 people
Browsers
- IE 38%
- IE9 21%
- IE8 12%
- IE7 5%
- Safari 28%
- Firefox 17%
- Chrome 15%
Platforms
- Windows 64%
- Mac 25%
- iPhone 4%
- iPad 3%
- Android 2%
m.nd.edu
Traffic
- 27,291 views by 3,396 people
- Top Content
- Map
- Athletics
- Webcams
- News
- Food
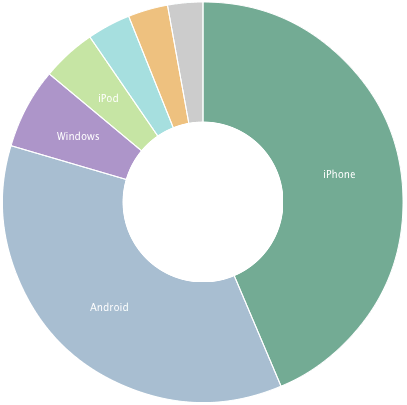
Platforms
- iPhone 41% (+4%)
- Android 32%
- Windows 18% (+9%)
- BlackBerry 2%
- iPod 1%
- iPad 3%
Conductor
- 284 live sites (+9)
Traffic
- 2,136,764 views by 444,517 people
Browsers
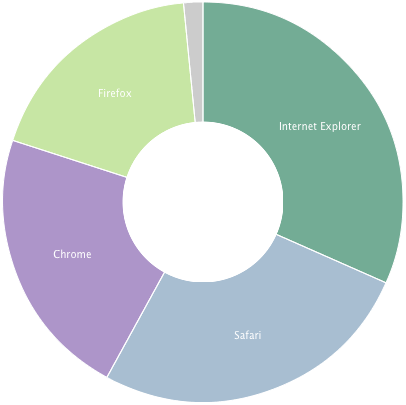
- IE 32%
- IE9 16%
- IE8 11%
- IE7 4%
- Safari 26%
- Chrome 22%
- Firefox 18%
Platforms
- Windows 62%
- Mac 26%
- iPad 5%
- iPhone 4%
- Android 2%
Stats are from Gaug.es by Github and Google Analytics.
June 2012 Stats
This month’s stats showed an overall drop in traffic (school’s out for summer). The biggest jumps this month were for m.nd.edu where iPhone traffic dropped by 9% (-3% drop for iOS overall) and Windows traffic went up 4%.
ND.edu
Traffic

- 679,9634 views by 188,925 people
Browsers
- IE 37% (-4%)
- IE9 20%
- IE8 12%
- IE7 5%
- Safari 30% (+3%)
- Firefox 18%
- Chrome 15%
Platforms
This month, Windows dropped 2% and all three mobile stats noted increased slightly.
- Windows 63% (-2%)
- Mac 24%
- iPhone 5% (+2%)
- iPad 4%
- Android 3%
m.nd.edu
Traffic

- 24,275 views by 2,843 people
- Top Content
- Athletics
- News
- Webcams
- Map
- People
Platforms
- iPhone 37% (-9%)
- Android 35%
- Windows 9% (+4%)
- BlackBerry 4%
- iPod 8% (+4%)
- iPad 1% (-2%)
Conductor
- 275 live sites (+5)
Traffic
- 2,020,942 views by 417,645 people
Browsers

- IE 31%
- IE9 15%
- IE8 11%
- IE7 4%
- Safari 25% (-2%)
- Chrome 23% (+2%)
- Firefox 20%
Platforms
- Windows 63% (+2%)
- Mac 25% (-2%)
- iPad 5%
- iPhone 4%
- Android 2%
Stats are from Gaug.es by Github and Google Analytics.