
Posted by Jody Peters, PalEON Program Manager
Prior to major land use changes, the tall grass prairie was a widespread ecotone in North America extending east into Minnesota, Illinois and Indiana. Caitlin Broderick, a

Figure 1. Study area. Townships within the Yellow River watershed.
University of Notre Dame undergraduate working in the McLachlan lab, wanted to learn more about the edge of the prairie this spring semester. She could have listened to NPR’s Garrison Keillor describe life in Lake Wobegone on the edge of the prairie in Minnesota. But given that Notre Dame has been compiling historical records of trees from Indiana and Illinois, she decided to look at bit closer to home and focused on townships that are within the Yellow River watershed. Coincidentally, this watershed is split almost in two by what is currently US 31 and what was historically known in the Public Land Survey (PLS) notes as the Michigan Road Lands. (Fig 1).
The following are some of the results Caitlin presented at the University of Notre Dame College of Science Joint Annual Spring Meeting.
 Currently, the Yellow River region is dominated by agriculture and deciduous forests (Fig 2). However, from a 1935 depiction of the extent of the prairie prior to Euro-American settlement, prairie ecosystems extended into northwest Indiana including into the Yellow River region (Fig 3; Transeau 1935). Caitlin explored what the edge of the prairie in the Yellow River region looked like during 1829-1837 using historical forest data obtained from PLS.
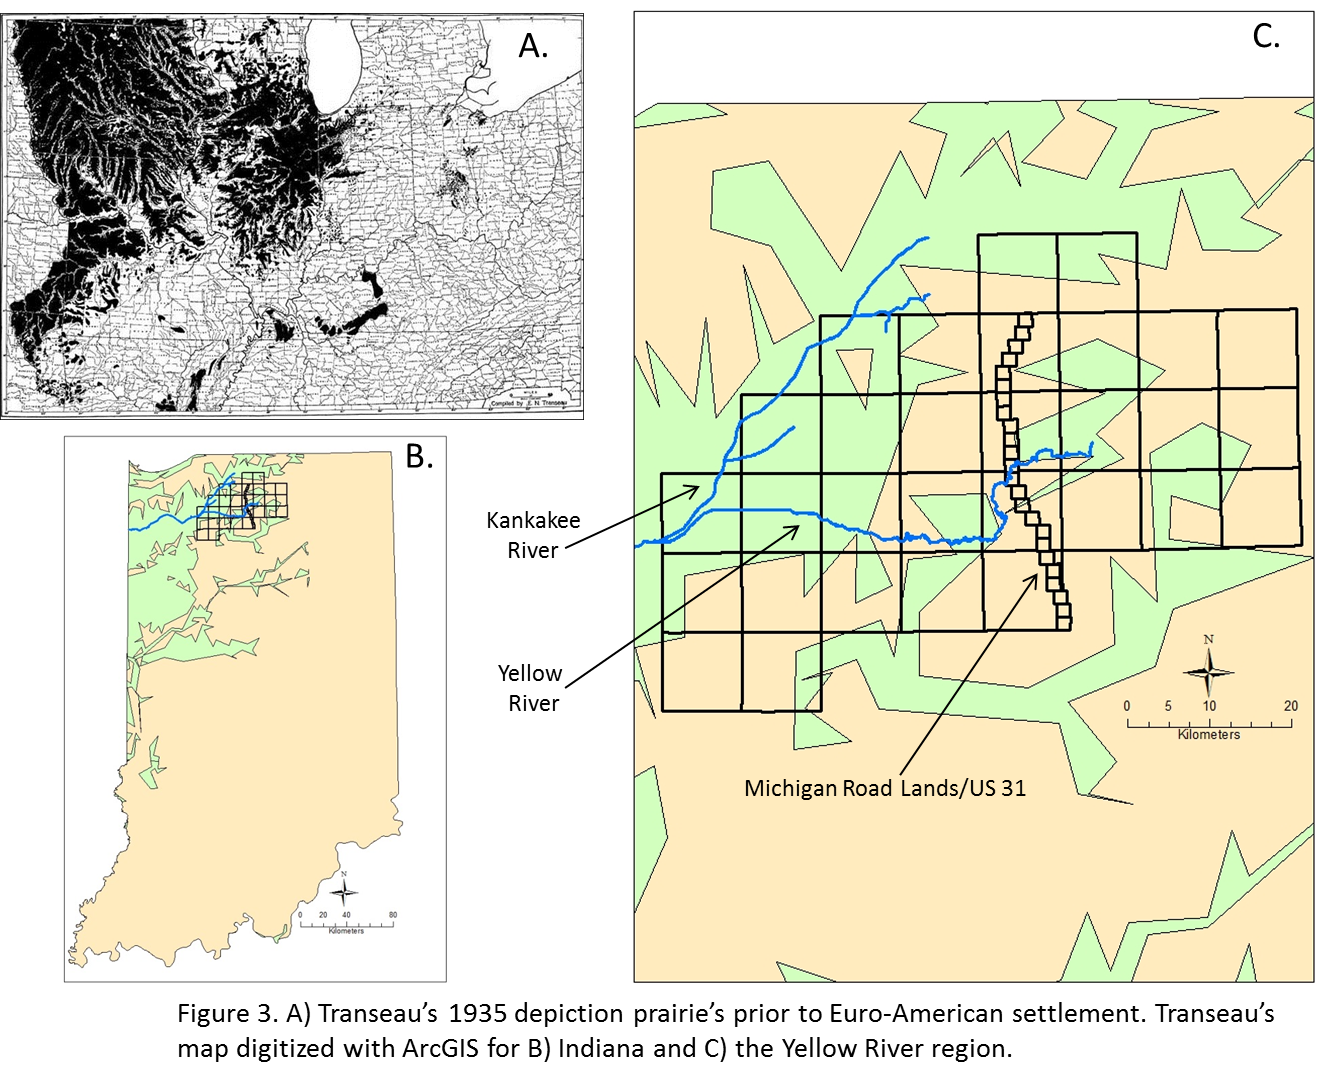 The survey notes provide identification of 1-2 trees, their diameters and distances from corner posts set every mile in each township (n=30 townships; 1055 corners). For this study, trees at each corner were categorized as “Oak” (only oaks were present), “Other” (22 non-oak tree taxa which were dominated by beech, ash, maple and elms), or “Oak + Other” (a combination of oak and non-oak trees). There were also corners that were categorized as “Water” (in lakes, rivers, creeks, etc.), “No Tree” (had a post set in a mound but with no trees nearby), or “No Data” (corners with no information provided in the notes).
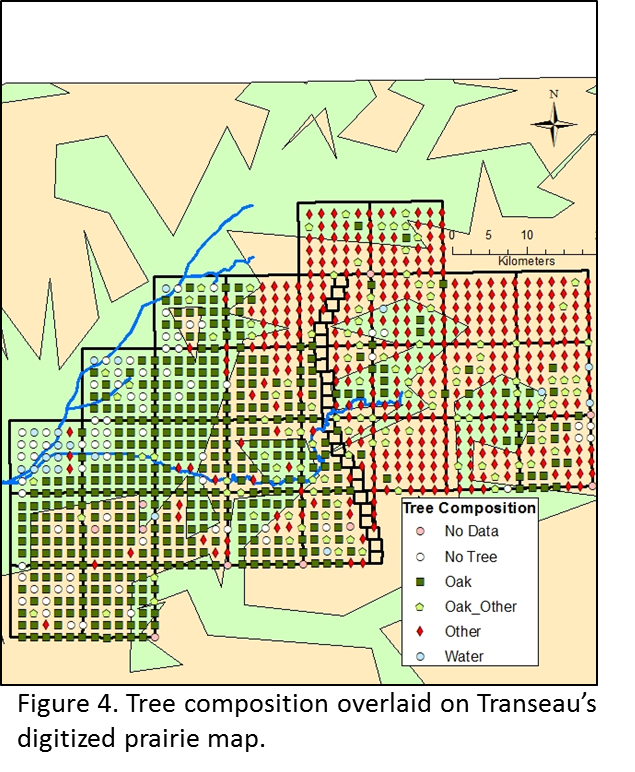
Caitlin used Arc GIS to map the tree composition at each corner (Fig 4). Much to our surprise, she did not see many corners with no trees in the areas of Transeau’s prairie in the Yellow River region. However, there was a striking pattern in the distribution of the trees, with the majority of the trees to the west of the Michigan Road Lands being oaks and those to the east being other hardwoods.
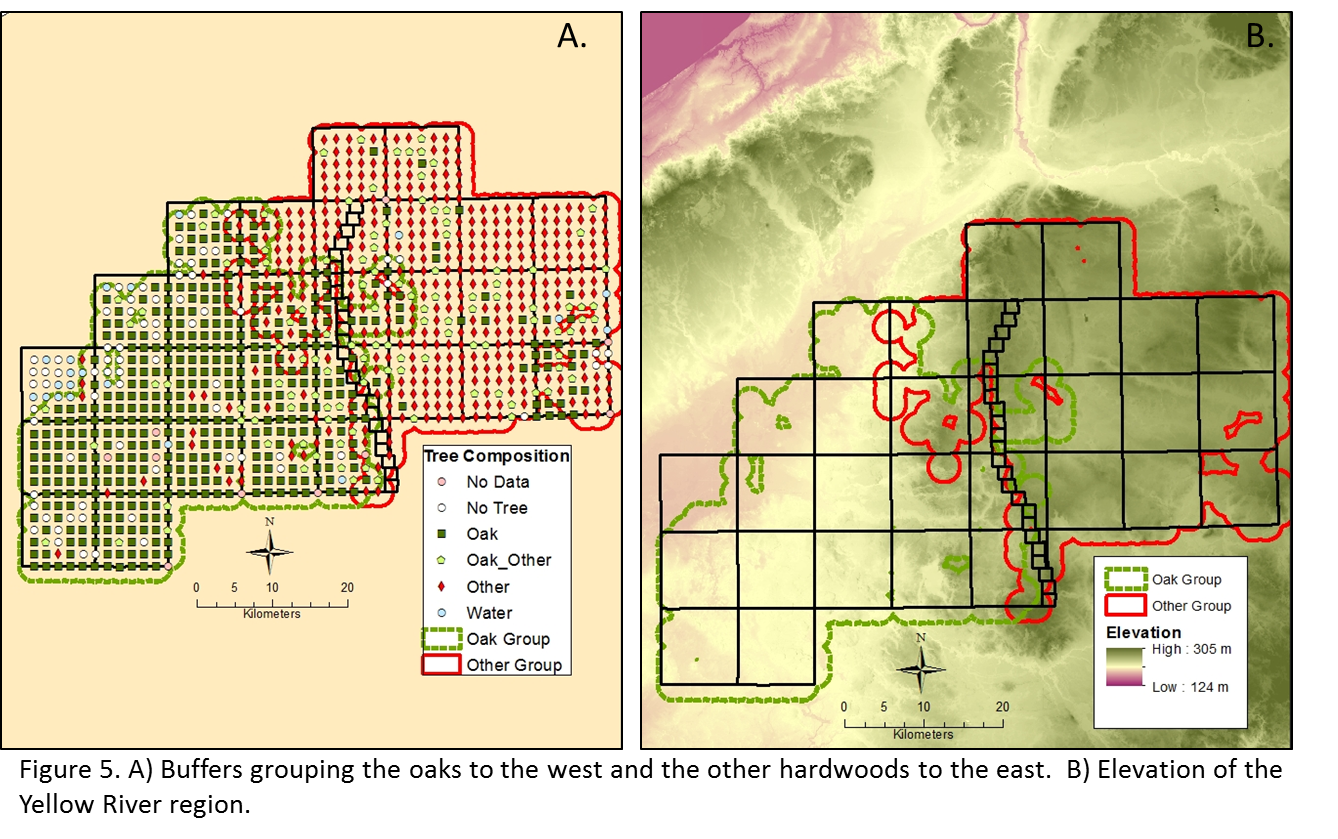
In addition to examining tree composition, Caitlin wanted to look at the structure of the trees and the physical environment across the region. To better define the two groups of trees (Oaks to the west and Other hardwoods to the east), Caitlin created buffers around individual corners and dissolved the buffers with matching tree classifications to create two groups of trees (Fig 5A). Comparing the trees in the two groups, Caitlin found that there was no difference in tree diameter (mean (cm)± se; Oak: 40.9± 0.5; Other: 40.2± 0.6). However, the trees in the Oak group were significantly further from the corner posts compared to the Other group (mean (m)± se; Oak: 36.2± 4.3; Other: 13.6± 2.4; p<0.001). Given that there was a difference in the tree composition and distance from the corners, Caitlin looked at climatic and physical features that could help explain this difference between the oaks of the west and the other hardwoods in the east. There was no ecological difference in either temperature or precipitation (mean± se; Temperature (ºC): Oak: 9.88± 0.003; Other: 9.89± 0.003; Precipitation (mm): Oak: 1010± 0.59; Other: 1007± 0.74). However, although northern Indiana is quite flat, as with the tree composition, there was a striking difference in the pattern of elevation change across the Yellow River region that mirrored the change in the tree distribution. Trees in the Oak group were at significantly lower elevation compared to trees in the Other group (mean (m)± se; Oak: 225.5± 0.7, Other: 251.0± 0.6; p<0.01; Fig 5B).
I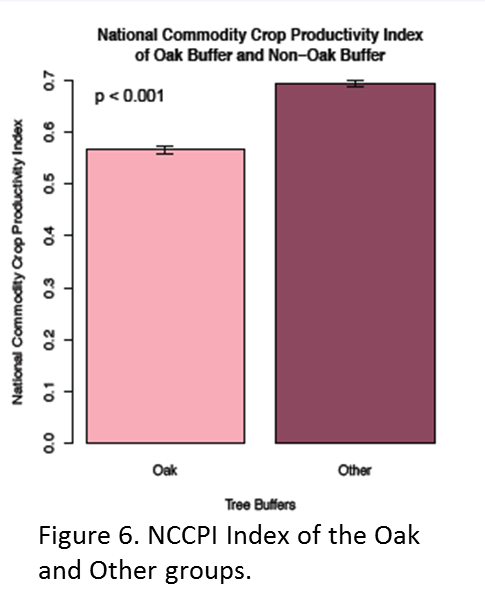 n addition to exploring what the historical prairie-forest boundary looked like, Caitlin compared the National Commodity Crop Productivity Index (NCCPI) to see if there is a lasting impact on the current crop production by the physical factors that contributed to the differences in historical tree composition and structure. The NCCPI models the ability of soils, landscapes, and climates to foster non-irrigated commodity crop productivity (Dobos et al. 2012). Caitlin found there was in fact, a difference between NCCPI of the two groups with crop productivity being significantly lower in the western area historically dominated by low density Oak tree communities (Fig 6).
Typically when people think of prairies, they think of open expanses of grass. However, over the spring semester Caitlin found that in the Yellow River region of northern Indiana, the prairie described by Transeau actually looked more like a low density oak community compared to the closed forests further east. While at first glance we can no longer see the prairie’s edge in the current vegetation of northern Indiana (Fig 2), when Caitlin looked closer, the factors that once controlled the boundary between the closed forests of the east and the open savannas moving west may still be at work limiting crop production in what was once savanna compared to production in the historically wooded uplands (although what these factors specifically are is still an open question).
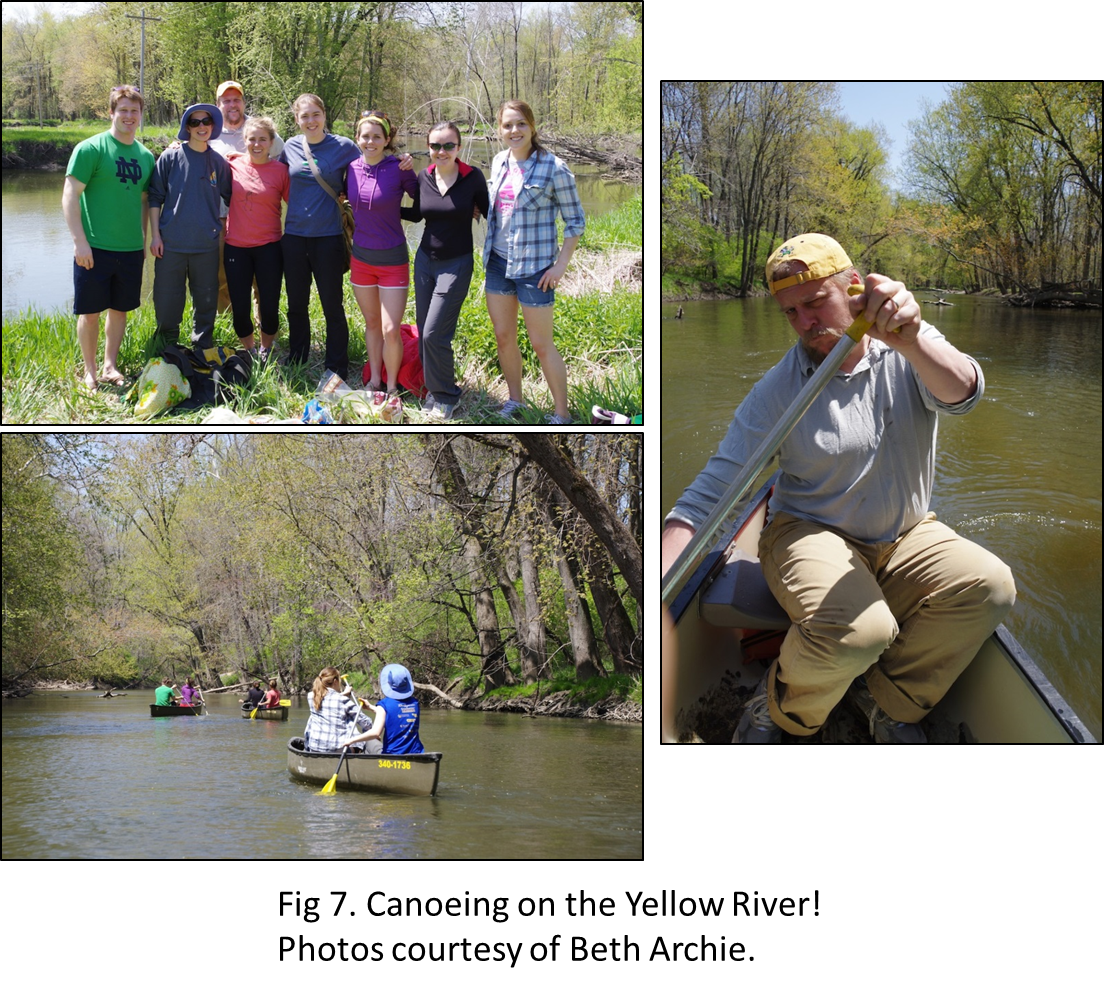
As a fun follow-up to Caitlin’s research, nine of us took a lab canoe trip down the Yellow River. Although we didn’t see the same striking pattern of oaks to the west and other hardwoods to the east, as we drove the 50 minutes south on US 31 to get to the River, we did see small stands of hardwoods intermingled with a number of lone oaks standing in the middle of corn and soybean fields. On our way to the ice cream store after our canoe trip, we also saw some of the lasting impacts of the oak savannas as we drove through Burr Oak, Indiana. According to McDonald (1908), the village plat was filed in 1882 and was “nearly in the center of what is known as the “Burr Oak Flats”, which is as beautiful and productive a region as can be found anywhere.”
The trip down the Yellow River was a wonderful way to get outside on a beautiful spring day and experience firsthand the watershed/ecosystem that Caitlin has spent this spring studying in the lab. The river was an easy enough paddle that novice canoers would be comfortable, but had enough downed trees to provide excitement for the more experienced canoer. If you are ever in the area, connect with the Little Bit Canoe Rental. They do a wonderful job providing canoes and transport. Here are a couple of pictures of the fun!
References
Dobos, R.R., H.R. Sinclair, Jr., M.P. Robotham. 2012. User Guide for the National Commodity Crop Productivity Index (NCCPI), Version 2.0. Access pdf at the bottom of the page here.
McDonald, D. 1908. A Twentieth Century History of Marshall County, Indiana, Volume 1. Lewis Publishing Company, pg 134. Online access here.
Transeau, E. N. 1935. The Prairie Peninsula. Ecology 16(3): 423-437.