Post by Kevin Burke, Graduate Student at the University of Wisconsin, Madison working with Jack Williams.
Since Lennart Von Post presented the first modern pollen diagram in 1916, the palynological community has been working to better understand the relationship between pollen abundances recovered from sediments, and the vegetation that produces this pollen.1,2 Throughout the twentieth century great strides have been made in quantitatively reconstructing past vegetation from relative pollen percentages. Mechanistic transport models by Colin Prentice and Shinya Sugita use taxonomic abundance and pollen productivity to estimate pollen source area, while other recent work by PalEON member Andria Dawson study this relationship using sophisticated Bayesian hierarchical models.3,4 However, these approaches all tend to use simplifying assumptions, including constant, uniform wind speeds, and a circular source area. Our work here seeks to challenge and improve upon some of these underlying assumptions by developing a pollen transport model that includes realistic, variable wind speeds and directions. Moreover, we are using the historical estimates of vegetation developed by the PalEON project.
Using North American Regional Reanalysis (NARR) wind data, a vegetation dataset of tree composition pre-Euro-American settlement , fossil pollen records from the Neotoma Paleoecology Database, and taxon-specific measurements of settling velocities for pollen grains, we are producing improved estimates of pollen loading (in grains per square meter) for lakes across the Prairie-Forest ecotone in the upper Midwest. This work recently won an Outstanding Student Paper Award from the 2014 Fall Meeting of the American Geophysical Union.
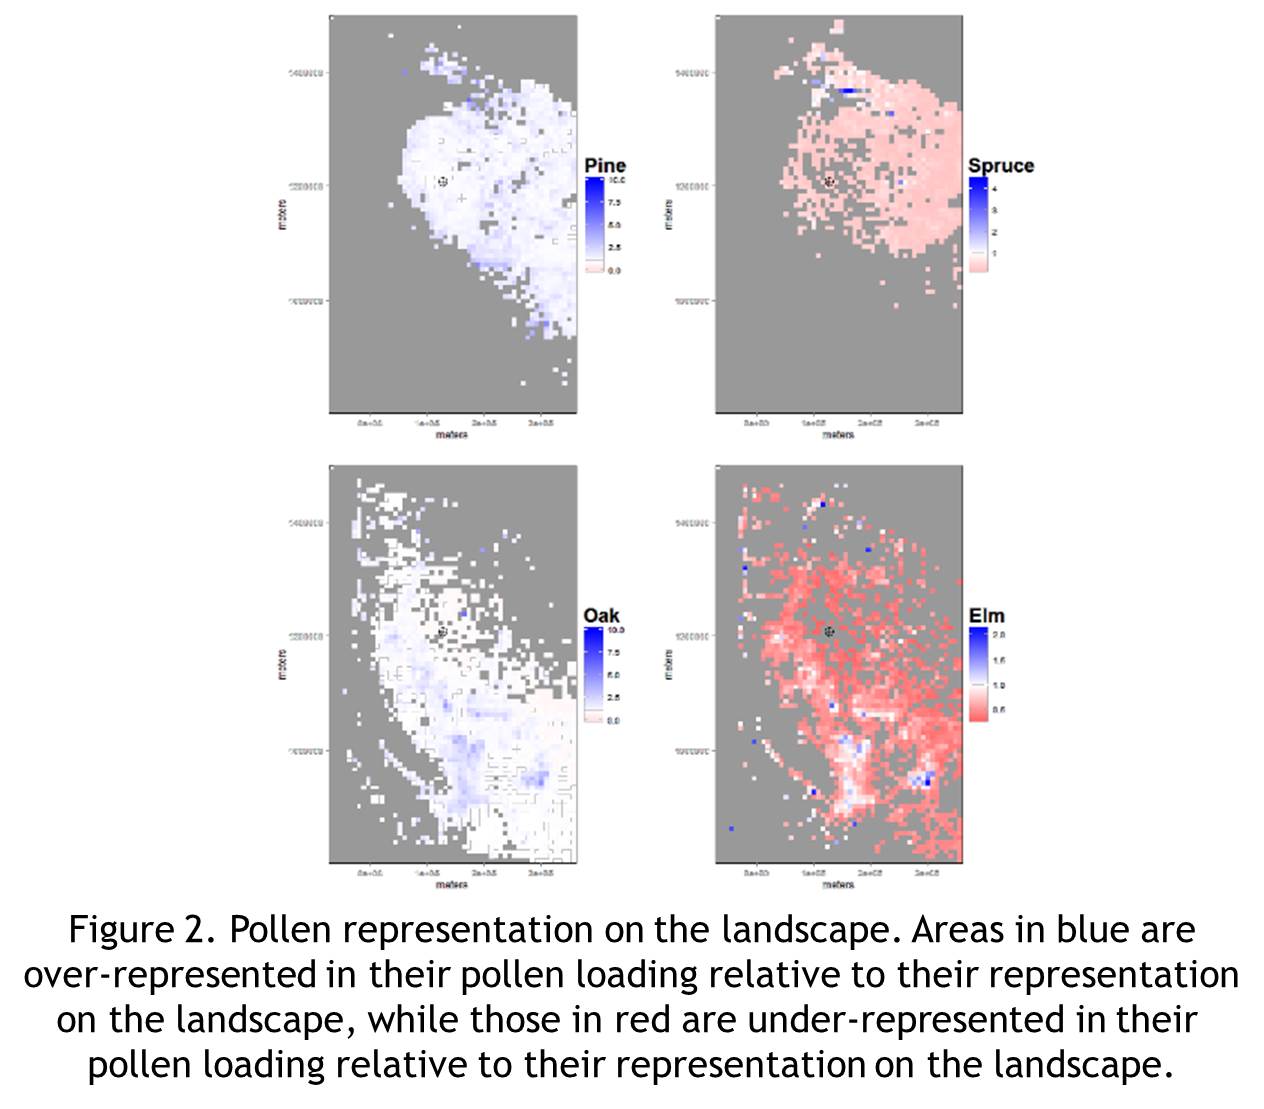
While the source area is largely governed by presence/absence of taxa in the vegetation dataset, things become much more interesting when looking at the ratio of relative proportion of pollen loading to relative proportion of trees per grid cell. We see that some taxa are much better represented in the pollen records given the number of trees on the landscape.
We can also see that whether a given taxon is over- or underrepresented varies spatially, based on distance to lake and the other taxa present in a given grid cell. These results shed light on the potential magnitude of a regional pollen source area, and help elucidate the relationship between pollen in a sediment core and trees on the landscape. Ultimately, this kind of work can be used to build more accurate reconstructions of past vegetation from fossil pollen records. From there, these paleovegetation reconstructions can be used to better constrain and improve terrestrial ecosystem models – a central goal of the PalEON project.
To see more results, including preliminary comparisons to pollen counts from sediment cores, you can check out our American Geophysical Union poster here.
References:
- Fries, M. Review of Palaeobotany and Palynology, 1967.
- Marquer et al. Quaternary Science Reviews, 2014.
- Prentice, C. Quaternary Research, 1985.
- Sugita, S. Quaternary Research, 1993.


