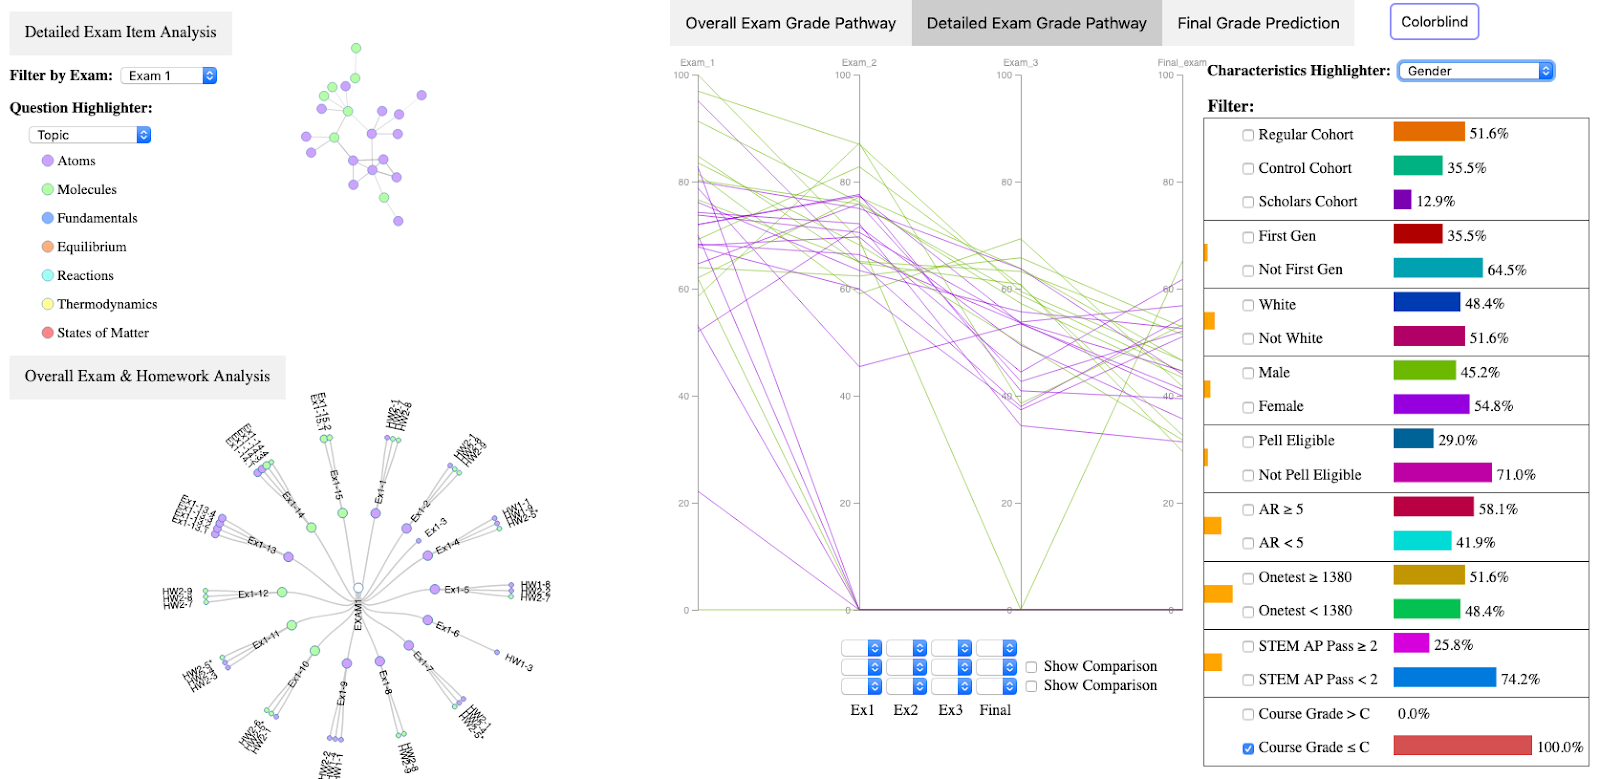
PerformanceVis is a visual analytics tool developed for analyzing and visualizing students’ chemistry course performance through the lens of time, homework and exams, and demographic and academic background. The Introduction to Chemical Principles course is a required course for all college of science and college of engineering programs at the university and is the second largest course on campus with approximately 1,000 freshmen taking the course.
This engaging tool includes four main views (overall exam grade pathway, detailed exam grade pathway, detailed exam item analysis, and overall exam & homework analysis) which are dynamically linked together for user interaction and exploration. PerformanceVis enables instructors to improve their course and assessment design by visualizing students’ perceived difficulty level and topic correlation between assignments and exams. It assists instructors and administrators in evaluating the impact of a special treatment program (cohort) by reviewing the performance of regular, control, and cohort students overall and by exam. The image below shows a screenshot of PerformanceVis with the right side of the image showing a view of the gender performance gap for those students who were not thriving. The left side of the image shows Exam 1 item analysis for each test question.
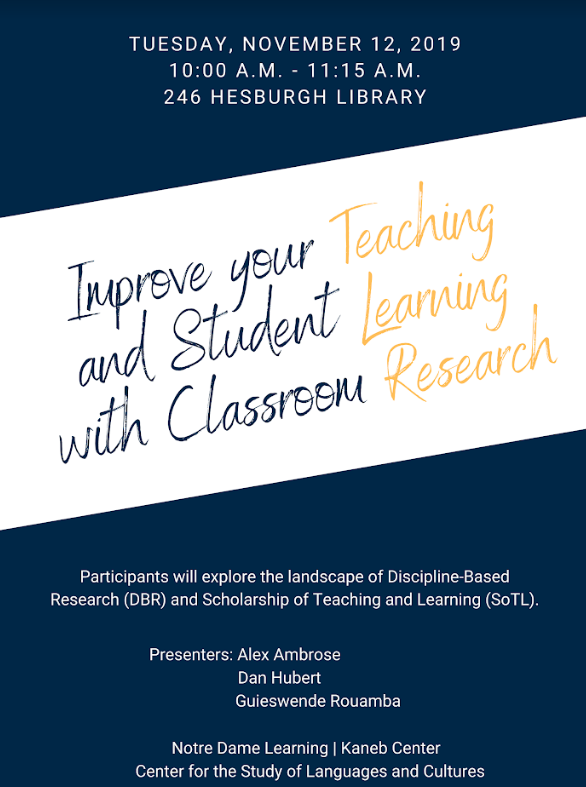
Ambrose, G. Alex, Hubert, Dan, Rouamba, Guieswende (2019) “Improve your Teaching Student Learning with Classroom Research.” Kaneb Center for Teaching Excellence Workshop, Notre Dame, IN.
Click here for the slide deck
Click here for the handout
Participants will:
Explore the landscape of Discipline-Based Research (DBR) and the Scholarship of Teaching and Learning (SoTL).
Brainstorm potential research goals, questions, and data for their own course.
Become familiar with applied learning research support services and resources (e.g. survey/rubric design, video observation, consent forms, and umbrella IRB).
ABSTRACT: The challenge was to identify and help underserved and underprepared students in an introductory chemistry course to be retained and thrive in the college of science or engineering while supporting the general population. In this paper, we describe our methods for identifying these students, evaluating the impact of a special treatment program that was provided to a subset of those students, discuss our efforts to help the general population, and evaluate the short- and long-term impacts. In particular, we discuss a data-informed framework for analyzing student and outcome variables.
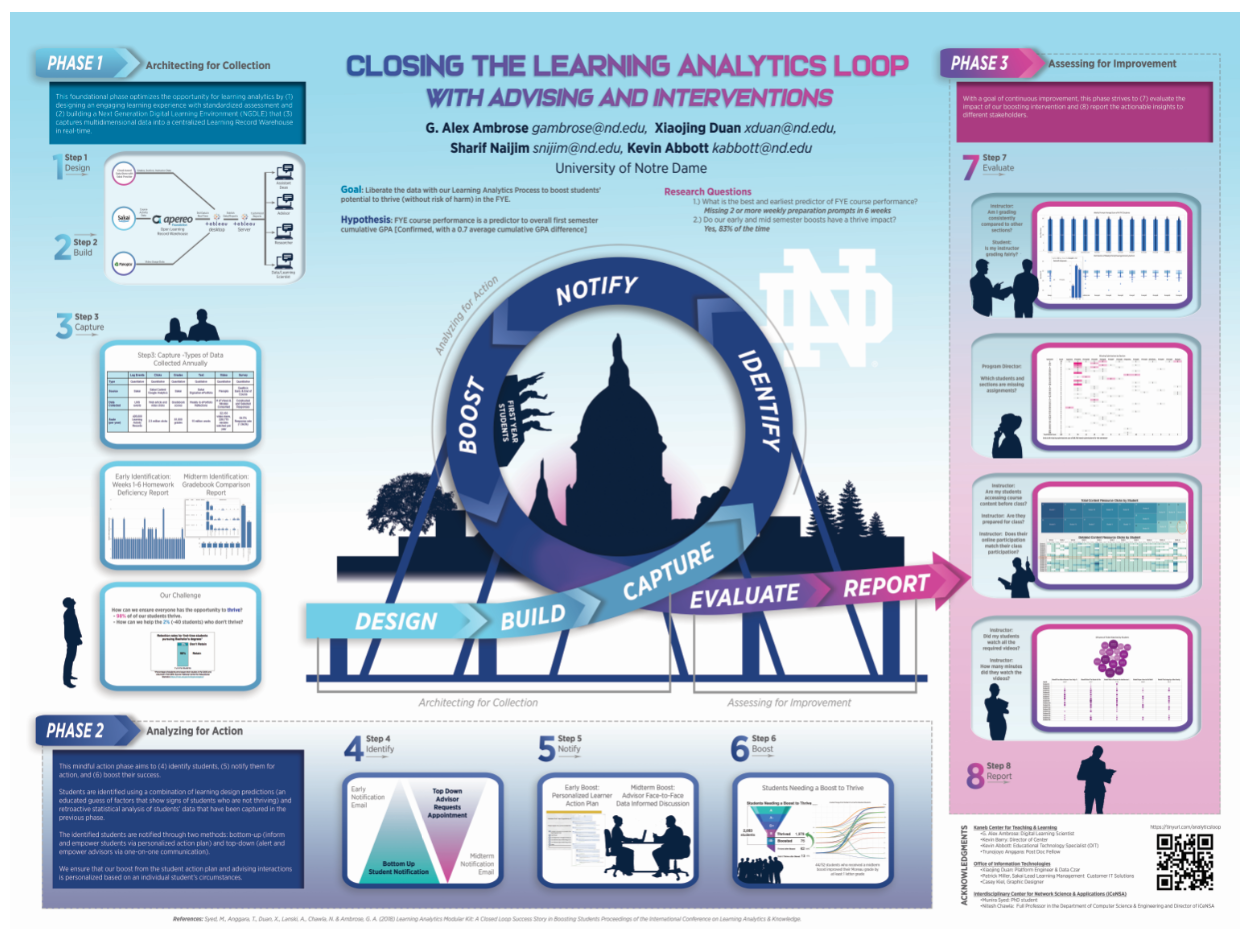
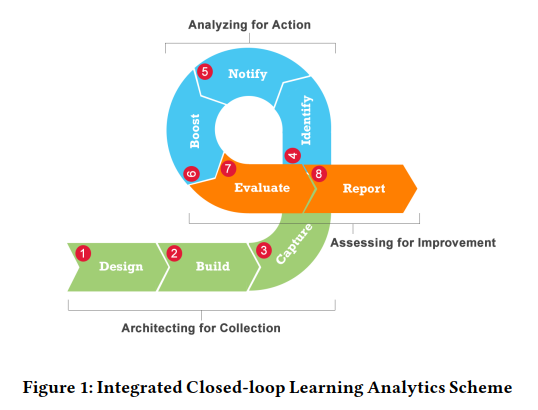
Identifying non-thriving students and intervening to boost them are two processes that recent literature suggests should be more tightly integrated. We perform this integration over six semesters in a First Year Experience (FYE) course with the aim of boosting student success, by using an integrated closed-loop learning analytics scheme that consists of multiple steps broken into three main phases, as follows: Architecting for Collection (steps: design, build, capture), Analyzing for Action (steps: identify, notify, boost), and Assessing for Improvement (steps: evaluate, report). We close the loop by allowing later steps to inform earlier ones in real-time during a semester and iteratively year to year, thereby improving the course from data-driven insights. This process depends on the purposeful design of an integrated learning environment that facilitates data collection, storage, and analysis. Methods for evaluating the effectiveness of our analytics-based student interventions show that our criterion for identifying non-thriving students was satisfactory and that non-thriving students demonstrated more substantial changes from mid-term to final course grades than already-thriving students. Lastly, we make a case for using early performance in the FYE as an indicator of overall performance and retention of first-year students.
ABSTRACT
Identifying non-thriving students and intervening to boost them are two processes that recent literature suggests should be more tightly integrated. We perform this integration over six semesters in a First Year Experience (FYE) course with the aim of boosting student success, by using an integrated closed-loop learning analytics scheme that consists of multiple steps broken into three main phases, as follows: Architecting for Collection (steps: design, build, capture), Analyzing for Action (steps: identify, notify, boost), and Assessing for Improvement (steps: evaluate, report). We close the loop by allowing later steps to inform earlier ones in real-time during a semester and iteratively year to year, thereby improving the course from data-driven insights. This process depends on the purposeful design of an integrated learning environment that facilitates data collection, storage, and analysis. Methods for evaluating the effectiveness of our analytics-based student interventions show that our criterion for identifying non-thriving students was satisfactory and that non-thriving students demonstrated more substantial changes from mid-term to final course grades than already-thriving students. Lastly, we make a case for using early performance in the FYE as an indicator of overall performance and retention of first-year students.
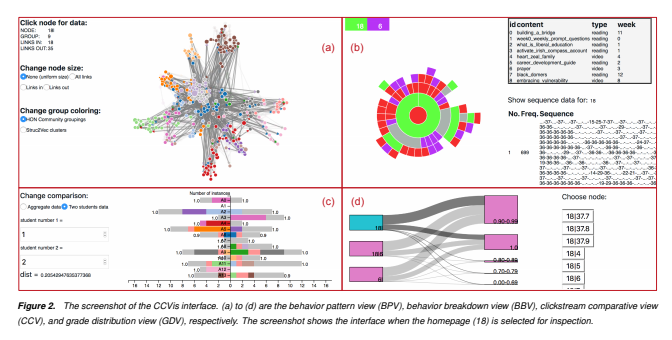
Abstract: As more and more college classrooms utilize online platforms to facilitate teaching and learning activities, analyzing student online behaviors becomes increasingly important for instructors to effectively monitor and manage student progress and performance. In this paper, we present CCVis, a visual analytics tool for analyzing the course clickstream data and exploring student online learning behaviors. Targeting a large college introductory course with over two thousand student enrollments, our goal is to investigate student behavior patterns and discover the possible relationships between student clickstream behaviors and their course performance. We employ higher-order network and structural identity classification to enable visual analytics of behavior patterns from the massive clickstream data. CCVis includes four coordinated views (the behavior pattern, behavior breakdown, clickstream comparative, and grade distribution views) for user interaction and exploration. We demonstrate the effectiveness of CCVis through case studies along with an ad-hoc expert evaluation. Finally, we discuss the limitation and extension of this work.
Celeste, M., Gronda E., Yang, Y., Tao, J., Wang, C., Duan, X., Ambrose, G., Abbott, K., Miller, P. (2018) CCVis: Visual Analytics of Student Online Learning Behaviors Using Course Clickstream Data. IS&T International Symposium on Electronic Imaging Conference. [Click here for the paper]
Note this paper was awarded the Kostas Pantazos Memorial Award for Outstanding Paper in Visualization and Data Analysis
A cross-campus team composed of faculty and staff from Kaneb, OIT, and FYS were awarded the 2018 Apereo Teaching And Learning Award (ATLAS). This international award recognizes innovation and excellence in the use of Apereo tools (Sakai), which enhance teaching, academic collaboration, student engagement, and learning. The major goals of the award include:
-Promote excellent pedagogy and innovation in teaching and learning;
-Create a community of educators who want to share teaching and learning practices;
-Encourage greater faculty involvement in the Apereo community.
The Apereo Foundation (http://www.apereo.org/) is a non-profit organization, with members drawn from higher education on four continents. It’s core mission is to provide a framework to assist and facilitate educational organizations to work together to foster, develop, and sustain open source technologies and innovation to support learning, teaching, and research. Apereo also provides a common organizational umbrella for higher education open source software projects and communities. Many of Notre Dame’s peer organizations are part of Apereo. Those include Duke, Yale, Stanford, Brown, Princeton, and others.
Each year, the Foundation selects nominations for the ATLAS award (Apereo Teaching and Learning Award) from the open source community that demonstrate innovative teaching and learning using an open source learning tool. Those awards include recognition at the annual Apereo international conference and funding for those team members to attend the conference and present on the winning nomination.
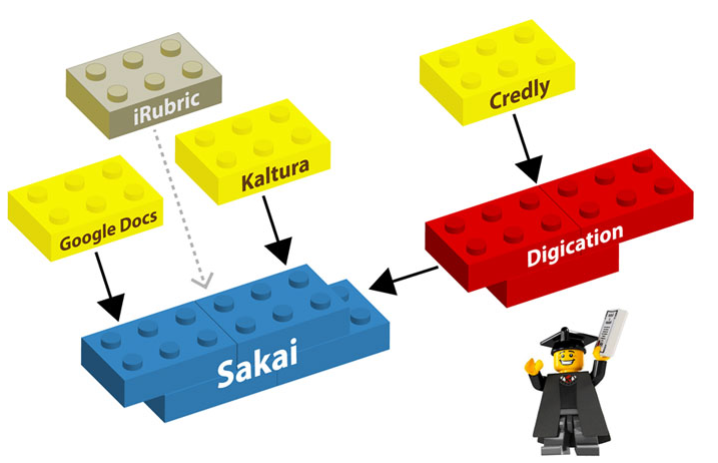
Our proposal was on the Moreau First Year Experience which is a required, two-semester sequence that helps first-year students make a meaningful transition to collegiate life at Notre Dame by integrating their academic, co-curricular, and residential experiences. Apereo tools form the digital framework of our courses. Our open-source learning management system, Sakai, contains all resource materials for both students and instructors as well as weekly reading/viewings and short reflections; a real-time gradebook; and a seamless interface with midterm and final ePortfolios assignments. Apereo tools ensure an innovative and transparent learning environment for our students, instructors and course administrators. We also worked with Digication, our ePortfolio provider, to create an LTI that would connect Digication to Sakai. That work was funded by Digication and we assisted with testing. The LTI was released by Digication for use by the Apereo community.
For more information:
-Click here for the announcement and to learn more about the award.
-Click here for our award submission
-Click here to read the story on the Academic Technology @ Notre Dame Blog
The interdisciplinary cross-campus team included:
Kevin Abbott, Office of Information Technologies
Alex Ambrose, Kaneb Center for Teaching & Learning
Alison Lanski, Kaneb Center for Teaching & Learning
Laura Cira, Office of Information Technologies
Laura Gekeler, Office of Information Technologies
Kevin Barry, Kaneb Center for Teaching & Learning
Maureen Dawson, First Year of Studies
Xiaojing Duan, Office of Information Technologies
Patrick Miller, Office of Information Technologies
Trunojoyo Anggara, First Year of Studies
Chris Clark, Kaneb Center for Teaching & Learning
Paul Turner, Office of Information Technologies
Munira Syed, Interdisciplinary Center for Network Science & Applications
Nitesh Chawla, Interdisciplinary Center for Network Science & Applications
For more information:
-To hear the full presentation you can watch the recorded webinar on YouTube here
-To view the slide deck from our presentation see the embedded google slides below
Award Presentation Abstract
At Notre Dame, our goal is for all our freshmen students to thrive. According to U.S. News & World Report, Notre Dame ranks in the top 10 of national universities for freshman retention with a 98% retention rate. You might be wondering why we would be concerned with our students thriving since 98% of our freshman class succeeds. Our challenge is to engage those struggling 2% early enough to take action.
Our First Year Experience course was designed to help our students reach their highest potential. We maximized Sakai for the overarching structure of the course and Open Learning Record Warehouse for gathering data. These ensured that all resources were available to students, at no cost, throughout the semester; that student work would be evaluated promptly and fairly; that course design and student progress were transparent; and that data was gathered for learning analytics and research.
This session will walk you through how we designed and implemented the course, connected the data to the Learning Record Warehouse, how we used predictive analytics to move 83% of students identified as underperforming to thriving, and what is the best and earliest predictor of student success.
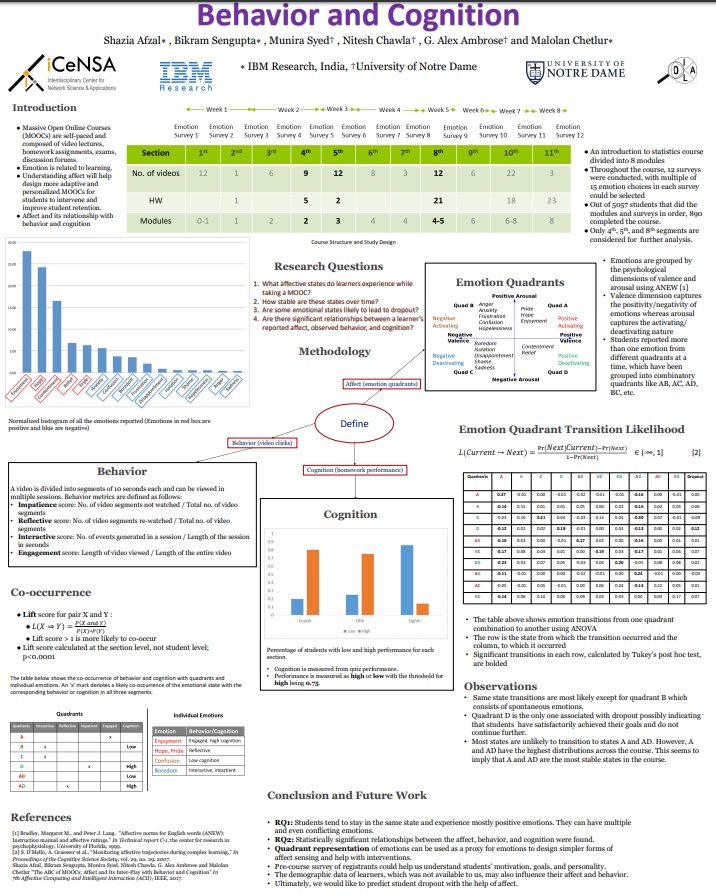
Shazia Afzal, Bikram Sengupta, Munira Syed, Nitesh Chawla, G. Alex Ambrose, and Malolan Chetlur. “The ABC of MOOCs: Affect and its inter-play with behavior and cognition.” In 2017 Seventh International Conference on Affective Computing and Intelligent Interaction (ACII), pp. 279-284. IEEE, 2017.
Abstract—We report on a study of affective states of learners in a Massive Open Online Course (MOOC) and the inter-play of Affect, Behavior and Cognition at various stages of the course. Affect is measured through a series of self-reports from learners at strategic time posts during the period of study. Behavior is characterized in terms of a learners’ engagement, interactivity, impatience and reflectivity, which constitute a set of novel high-level features derived from the clickstream of learner interactions. Cognition is evaluated from the performance of learners on assessments that are part of the course.We discover that learners in the MOOC experience multiple
as well as mixed emotions as they go through the course, which we handle using the psychological dimensions of arousal and valence. This results in a set of emotional quadrants, whose co-occurrence analysis reveals a strong association with
cognition and specific behavioral characteristics demonstrated by the learner. These results advance our understanding of the experience of MOOC learners to a more holistic level across the key dimensions of affect, behavior and cognition. They
also have important implications for the design of the next generation MOOCs that can potentially leverage affect and behavior-aware interventions to drive greater personalization and eventually, improved learning outcomes.
Title:
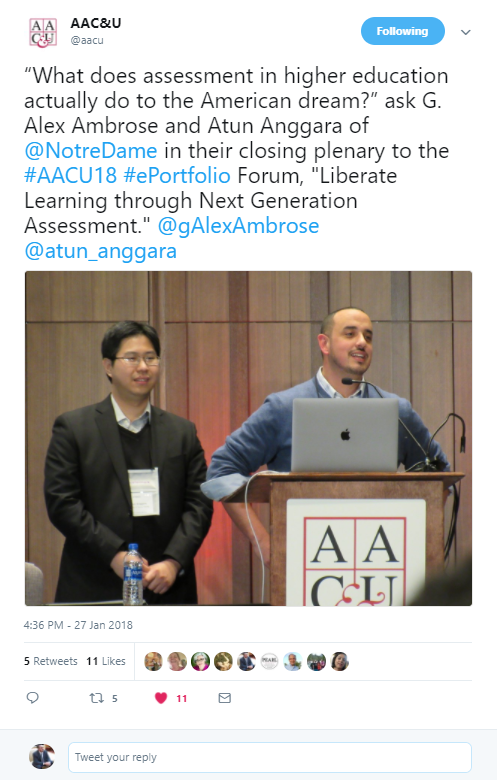
Liberate Learning through Next Generation Assessment
Abstract:
The ability to authentically capture and assess student opinions and growth has always been a challenge. Polls, surveys, and focus groups are some of the most common ways for administrators to gather assessment data at an institutional level; however, these indirect sources only serve as proxy indicators of student voices and experiences. And while ePortfolios may provide better and more authentic direct assessment, they are usually not faster or easier. How can we merge the efficiency of the forms, polls, and surveys with the power of ePortfolios to have a faster, better, and a deeper look into our students’ expectations? We will provide an overview of our current text mining assessment methods for over 2000 students ePortfolio reflections given specific prompts. These methods will provide a counter-narrative to indirect surveys that liberate all of our students’ unique voices and allow us to better align their aspirations in the arena of higher education. And answer the questions…What does assessment in higher education actually do to the American dream? How can we move beyond efficient assessment to more effective assessment thereby liberating the learning and the learners?
Presenters: G. Alex Ambrose, Program Director of ePortfolio Assessment, University of Notre Dame
Trunojoyo (Atun) Anggara, Academic Advisor and Educational Data Assessment Postdoctoral Fellow, University of Notre Dame
Citation: Ambrose, G. Alex, Anggara, Trunojoyo (2018) “Liberate Learning Through Next Generation Assessment” Association of American Colleges & Universities, 9th Annual Forum on Digital Learning and ePortfolios Closing Plenary. Washington, D.C
*A first-year experience course at the University of Notre Dame offered the opportunity to develop and test a next generation digital learning environment.
*As a guiding framework for the digital architecture of the new FYE course, the design team followed the five dimensions of an NGDLE described in an ELI report to close the gaps between current learning management tools and digital learning environments.
*The FYE course required innovating beyond the supplemental course-level learning management system to create a more holistic NGDLE in order to fully support the teaching, learning, and student success missions of the program.
*Because they used an open-source LMS, they had a flexible hub with a campus support staff that could quickly, inexpensively, and safely begin to innovate at scale without high vendor cost or long development times.