Description: We present an inclusive learning analytics framework for identifying at-risk or rather “non-thriving” students in a large-enrollment introductory general chemistry course. With the overall goals of closing opportunity gaps, maximizing all students’ potential for course success, and increasing STEM retention rates, our study used a hybrid approach of combining predictive modeling and domain experts decision-making to identify underperforming students during the early part of the course. We recognize that different institutions will have different definitions of thriving and course structures, but the methods we used in our study provide scholar-practitioners with a set of tools that can be replicated and customized for STEM courses on their campus.
We present a data-driven framework for identifying at-risk, or rather “non-thriving,” students in a large-enrollment introductory general chemistry course. This predictive learning analytic methodology was used to identify underperforming students during the early part of the course, through a hybrid approach of statistical modeling and domain expert decision making.
Description:
Background & Lit Review
There has been a long history and large body of knowledge in pursuing our research question in post secondary chemistry education. For most of these studies, the objective was to decrease drop, fail, withdrawal (DFW) rates by classifying “at-risk” predictors and intervening before the identified students began college coursework. These predictors often took the form of cognitive characteristics, such as standardized test scores, university-made placement exams focusing on mathematical ability, prior conceptual chemistry knowledge and logical reasoning skills. (Spencer1996; Kennepohl2010; Wagner2002; Pickering1975; Bird2010; Ozsogomonyan1979). Another less objective area of inquiry was students’ affective experiences which included self-concept, attitude, and motivation (Xu2013; Chan2014; DanielHouse1995), and intervention typically involved remedial courses(Kilner2018, Walmsley1977, Bentley2005; Mason2001; Kogut1993), or preparatory courses and transition programs (Hunter1976; Krannich2977; Shields2012, Stone2018). Previous efforts at our university include identifying non-thriving students during a required first-year-experience (FYE) course (Syed2019), and an introductory engineering course (Bartolini2020).
Research Problem
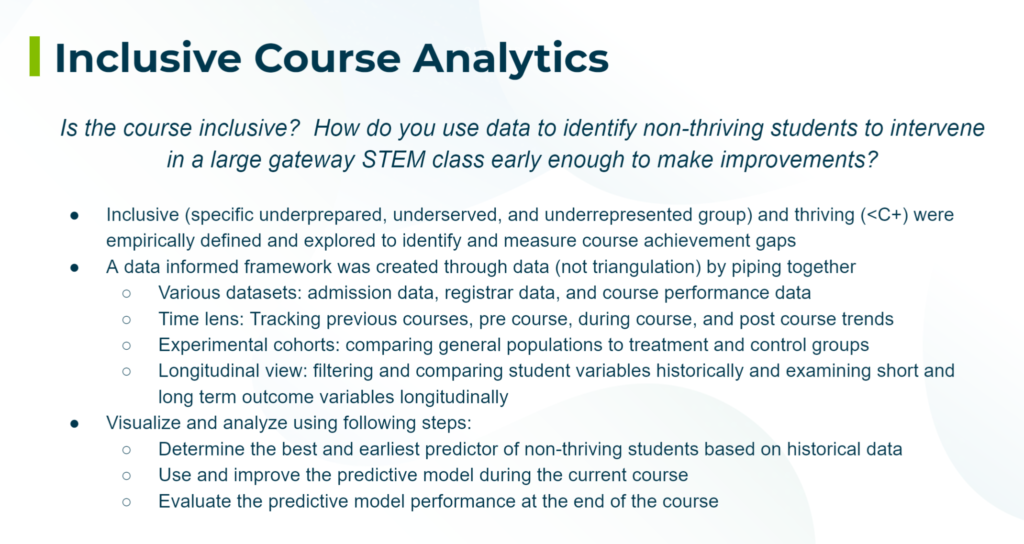
Although identifying “at-risk” students has been a popular field of research for introductory science courses, we make the distinction between “thriving” and “surviving” because the students identified in the current study are not necessarily at risk of failing the course, but they are likely to withdraw from the course or from their STEM program. How do you identify and intervene students who are not thriving while it is early enough to make improvements in the course?
Research Question
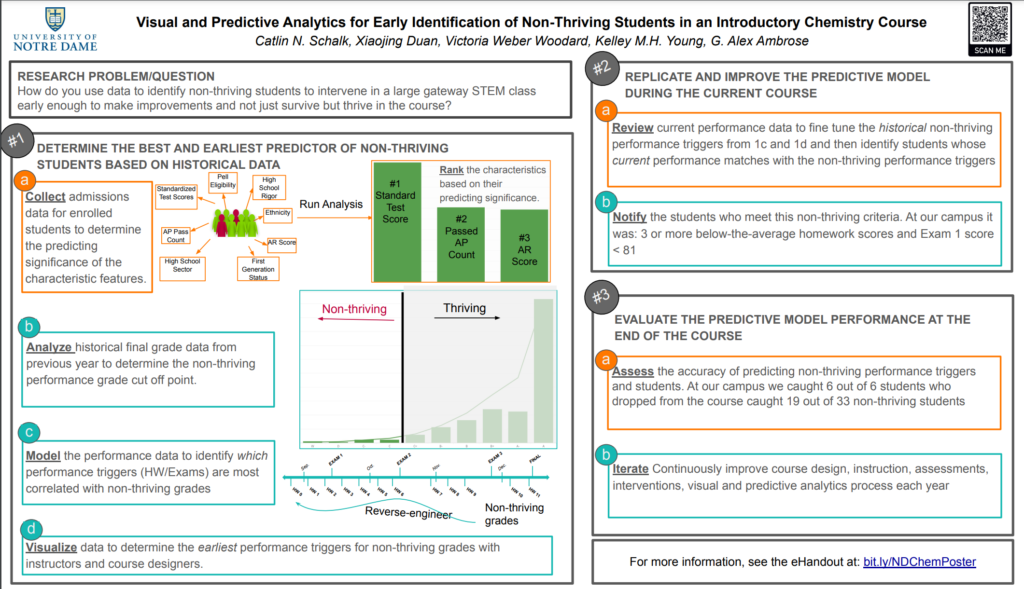
What are the best and earliest predictors of non-thriving learners early in the course, and what data-driven methods can we provide administrators and instructors to identify these students?
Method
Our hybrid approach combined exploratory data analysis to determine potential cut off points for non-thriving triggers through visualized data sets, and supervised machine learning to identify and utilize significant predictive features of students’ course success. Objective quantitative data was coupled with decision-making by domain experts (course professors and coordinators, advisors, data scientists, and learning experts from the university’s teaching and learning center). This modeling and visualization approach ensured campus context was taken into consideration when manipulating this largely data-driven approach. Our statistical analysis, suggested machine-learning models, and interactive visualizations of the multidimensional data sets are described in this section to show how we addressed our research question.
Step 1: Determine the non-thriving point for the final course grade.
1a. Collect historical performance data from the previous year.
1b. Visualize data into a grade distribution chart.
1c. Set the non-thriving point.
Step 2: Determine the best and earliest predictors of non-thriving students based on historical data.
2a. Collect historical performance data from the previous year and identify all non-thriving students.
2b. Model student data to identify the performance features most correlated to non-thriving performance.
2c. Visualize the data to determine the specific cut-off ranges.
Step 3: Replicate and improve the model early on during the current course.
3a. Export gradebook data for the current set of students at the data collection time point
3b. Filter the data to identify the students whose performance matched the predicted trigger for non thriving students from the previous year.
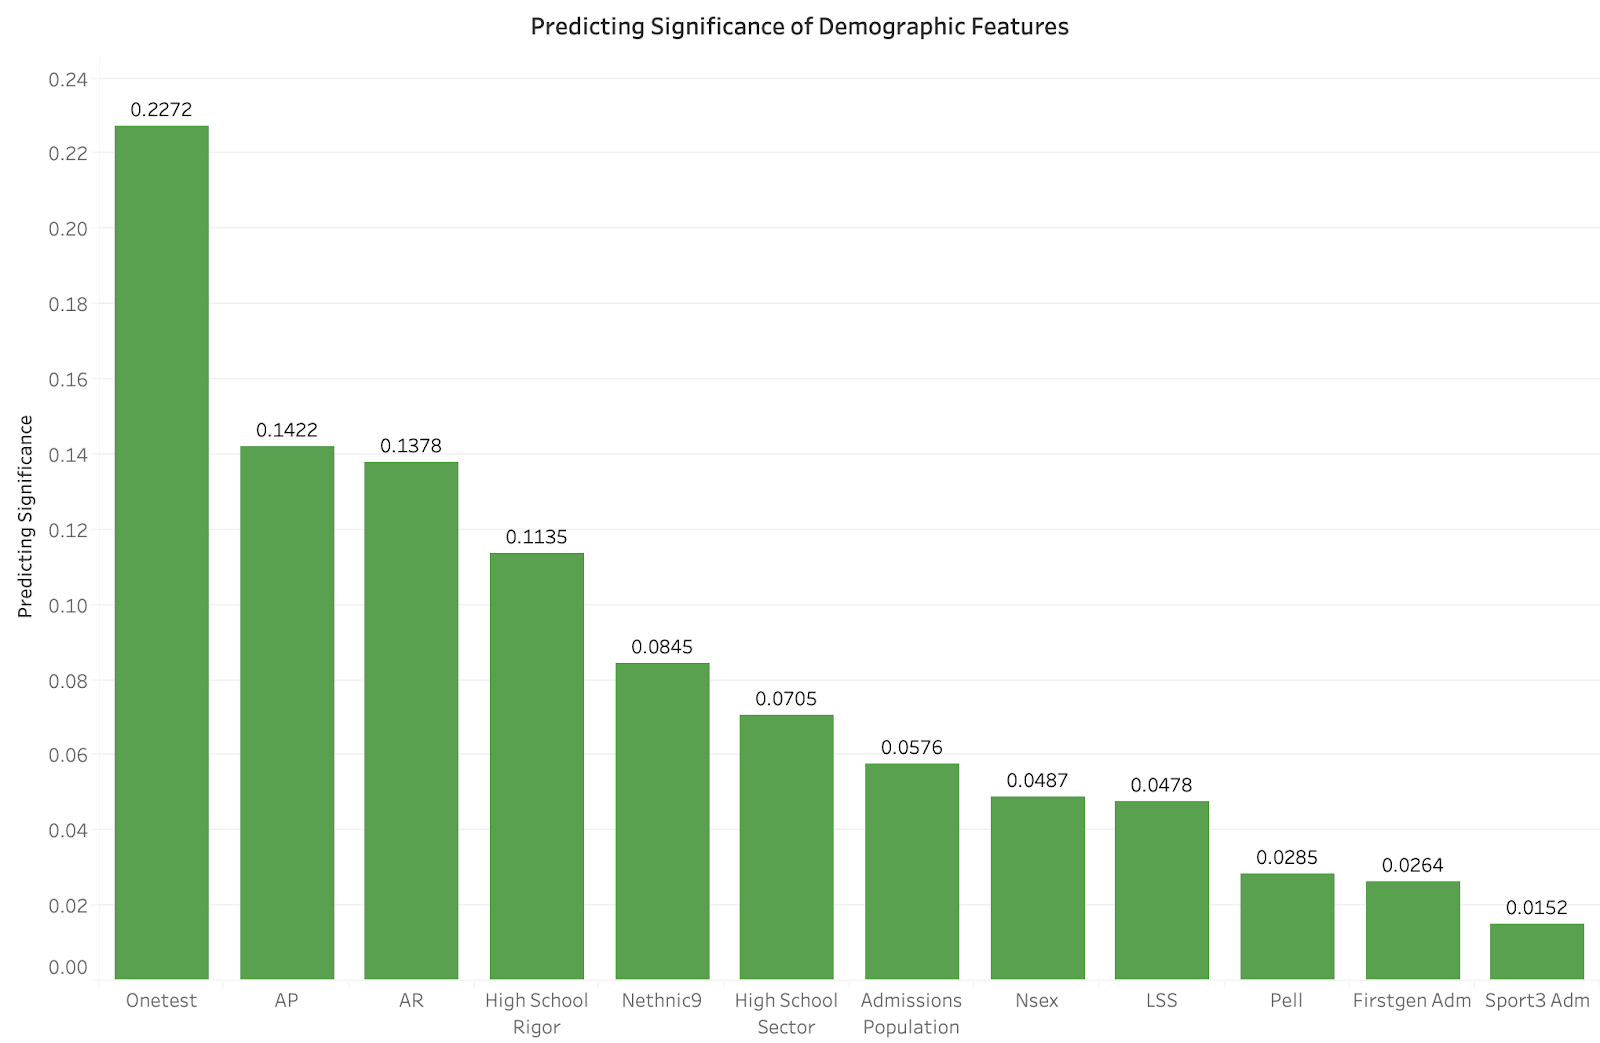
The earliest performance triggers for non-thriving grades ranked greatest to least from left to right.
Results & Conclusion
Student performance data was used to create learning analytics visuals to aid in discovering trends among non-thriving students, while domain experts made decisions about appropriate cut-off points to classify non-thriving performance. With the overall goals of closing opportunity gaps, maximizing all students’ potential for success in the course, and increasing STEM retention rates, we use student admissions and performance data visuals to ultimately create an environment that better supports all first semester chemistry students, and early on in the course.
Previous efforts to increase STEM retention rates have centered around identifying “at-risk” students before the course begins, based on admissions data. In this paper, we expanded the efforts of the current research in two areas: 1) broadening the search criteria to students who are likely non-thriving, not necessarily “at-risk” of failing the course; and 2) utilizing early and current course performance data instead of before-course characteristics. These two focus points allowed us to capture a more refined demographic of students, with the goal of helping all students to not just survive, but thrive in STEM programs. These methods better prepared us to support all students based on their performance in class, not just their before-course attributes, many of which are inherently biased and cannot account for many contextual differences. Additionally, in our approach to organizing data into interactive visual representations, we made our methods accessible to all faculty and administrators so that context-driven decisions can be made for the course.
With a largely data-driven approach, we sought to answer the research question: What are the best and earliest predictors of non-thriving learners early in the course, and what tools can we provide administrators and instructors to identify these students? Through a K- Nearest Neighbor modeling approach with one semester of data, it was determined that the best performance predictors of non-thriving students was 2 or more below-average homework scores, and an exam 1 score below 81. However, using these exact cutoffs did not appear to be the best strategy for identifying students in the following semester. A method of iterative refinement was implemented to update the appropriate selection criteria and will continue to be used until our model is fined tuned.
As we collect data from more semesters, we plan to continue to use of this iterative refinement on our model to determine the best set of assignments and amount of time needed to accurately predict the non-thriving status of our students. The methods we have described here provide scholar-practitioners with a set of tools that can be replicated and customized for STEM courses on their campus. We recognize that different institutions will have different definitions of thriving, and course structures. We provide examples specific to our institution for context, but we encourage those that seek to utilize our method to customize this process to one that fits the specifics of their institution. This will entail using data-driven approaches to identify a thriving cutoff point, suggesting a cutoff date and number of assignments for identifying non-thriving students, and implementing best-practice intervention approaches to offer students non-thriving students a boost.
References
Bentley, A. B.; Gellene, G. I. A six-year study of the effects of a remedial course in the chemistry curriculum. Journal of Chemical Education 2005, 82, 125–130.
Chan, J. Y.; Bauer, C. F. Identifying at-risk students in general chemistry via cluster analysis of affective characteristics. Journal of Chemical Education 2014, 91, 1417–1425.
Daniel House, J. Noncognitive predictors of achievement in introductory college chemistry. Research in Higher Education 1995, 36, 473–490.
Hunter, N. W. A chemistry prep course that seems to work. 1976; https://pubs.acs.org/sharingguidelines.
Kennepohl, D.; Guay, M.; Thomas, V. Using an online, self-diagnostic test for introductory general chemistry at an open university. Journal of Chemical Education 2010, 87, 1273–1277.
Kilner, W. C. ConfChem Conference on Mathematics in Undergraduate Chemistry Instruction: The Chem-Math Project. Journal of Chemical Education 2018, 95, 1436–1437.
Kogut, L. S. A general chemistry course for science and engineering majors with marginal academic preparation. Journal of Chemical Education 1993, 70, 565–567.
Krannich, L. K.; Patick, D.; Pevear, J. A pre-general chemistry course for the under-prepared student. Journal of Chemical Education 1977, 54, 730–735.
Mason, D.; Verdel, E. Gateway to Success for At-Risk Students in a Large-Group Introductory Chemistry Class. Journal of Chemical Education 2001, 78, 252–255.
Ozsogomonyan, A.; Loftus, D. Predictors of general chemistry grades. Journal of Chemical Education 1979, 56, 173–175.
Pickering, M. Helping the high risk freshman chemist. Journal of Chemical Education 1975, 52, 512–514.
Shields, S. P.; Hogrebe, M. C.; Spees, W. M.; Handlin, L. B.; Noelken, G. P.; Riley, J. M.; Frey, R. F. A transition program for underprepared students in general chemistry: Diagnosis, implementation, and evaluation. Journal of Chemical Education 2012, 89, 995–1000.
Stone, K. L.; Shaner, S. E.; Fendrick, C. M. Improving the success of first term general chemistry students at a liberal arts institution. Education Sciences 2018, 8, 5.
Spencer, H. E. Mathematical SAT test scores and college chemistry grades. Journal of Chemical Education 1996, 73, 1150–1153.
Syed, M.; Duan, X.; Anggara, T.; Alex Ambrose, G.; Lanski, A.; Chawla, N. V. Integrated closed-loop learning analytics scheme in a first year experience course. ACM International Conference Proceeding Series. New York, New York, USA, 2019; pp 521–530.
Wagner, E. P.; Sasser, H.; DiBiase, W. J. Predicting students at risk in general chemistry using pre-semester assessments and demographic information. Journal of Chemical Education 2002, 79, 749.
Walmsley, F. A course for the underprepared chemistry student. Journal of Chemical Education 1977, 54, 314–315.
Xu, X.; Villafane, S. M.; Lewis, J. E. College students’ attitudes toward chemistry, conceptual knowledge and achievement: Structural equation model analysis. Chemistry Education Research and Practice 2013, 14, 188–200.
Inclusive Curriculum Analytics for Undergraduate STEM Degrees: Using data to identify barriers, measure outcome disparities, and close achievement gaps
Abstract:
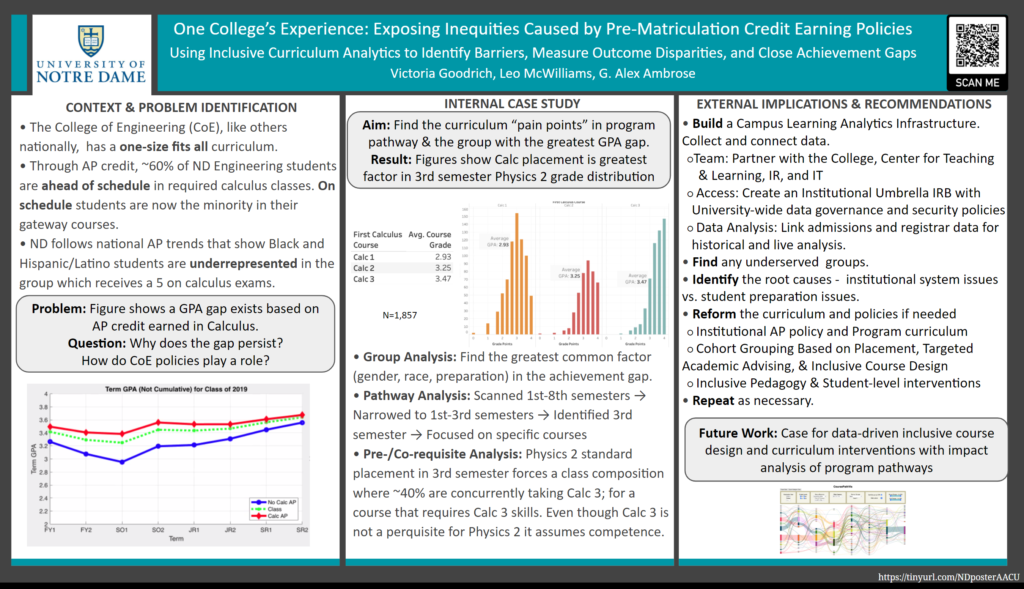
As formal credit earning opportunities grow, such as through credit by examination, it’s imperative that institutions understand how their advanced placement credit acceptance policies shape their students’ experiences on campus. While most schools have focused on how students with advanced credit perform in the follow on classes, fewer have focused on how these policies affect students without the same opportunities. This case study will answer: how do credit acceptance policies shape the student academic experience within one College of Engineering? The poster will focus on how one College of Engineering identified inequities through data driven study of students’ college performance as it relates to their credits earned prior to matriculation. It will provide a roadmap for other institutions to investigate their own student data as it pertains to current policies.
Background, Problem, & Evidence:
More and more students begin college having earned multiple college credits. As formal credit earning opportunities grow, such as through credit by examination, it is imperative that colleges and universities understand how their credit acceptance policies shape their students’ experiences on campus. While many studies have focused on program benefits such as additional schedule flexibility, less time to degree, and exposure to advanced topics, few have quantified the collateral impact of credit earning opportunities on the students that do not have credit when entering college. By not specifically quantifying and understanding this, it is easy to perpetuate or expand an achievement gap that started well before students enter college.
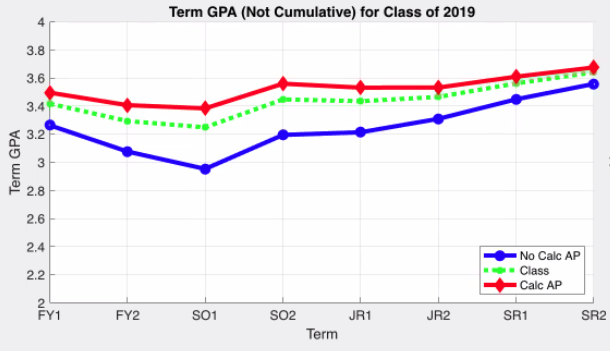
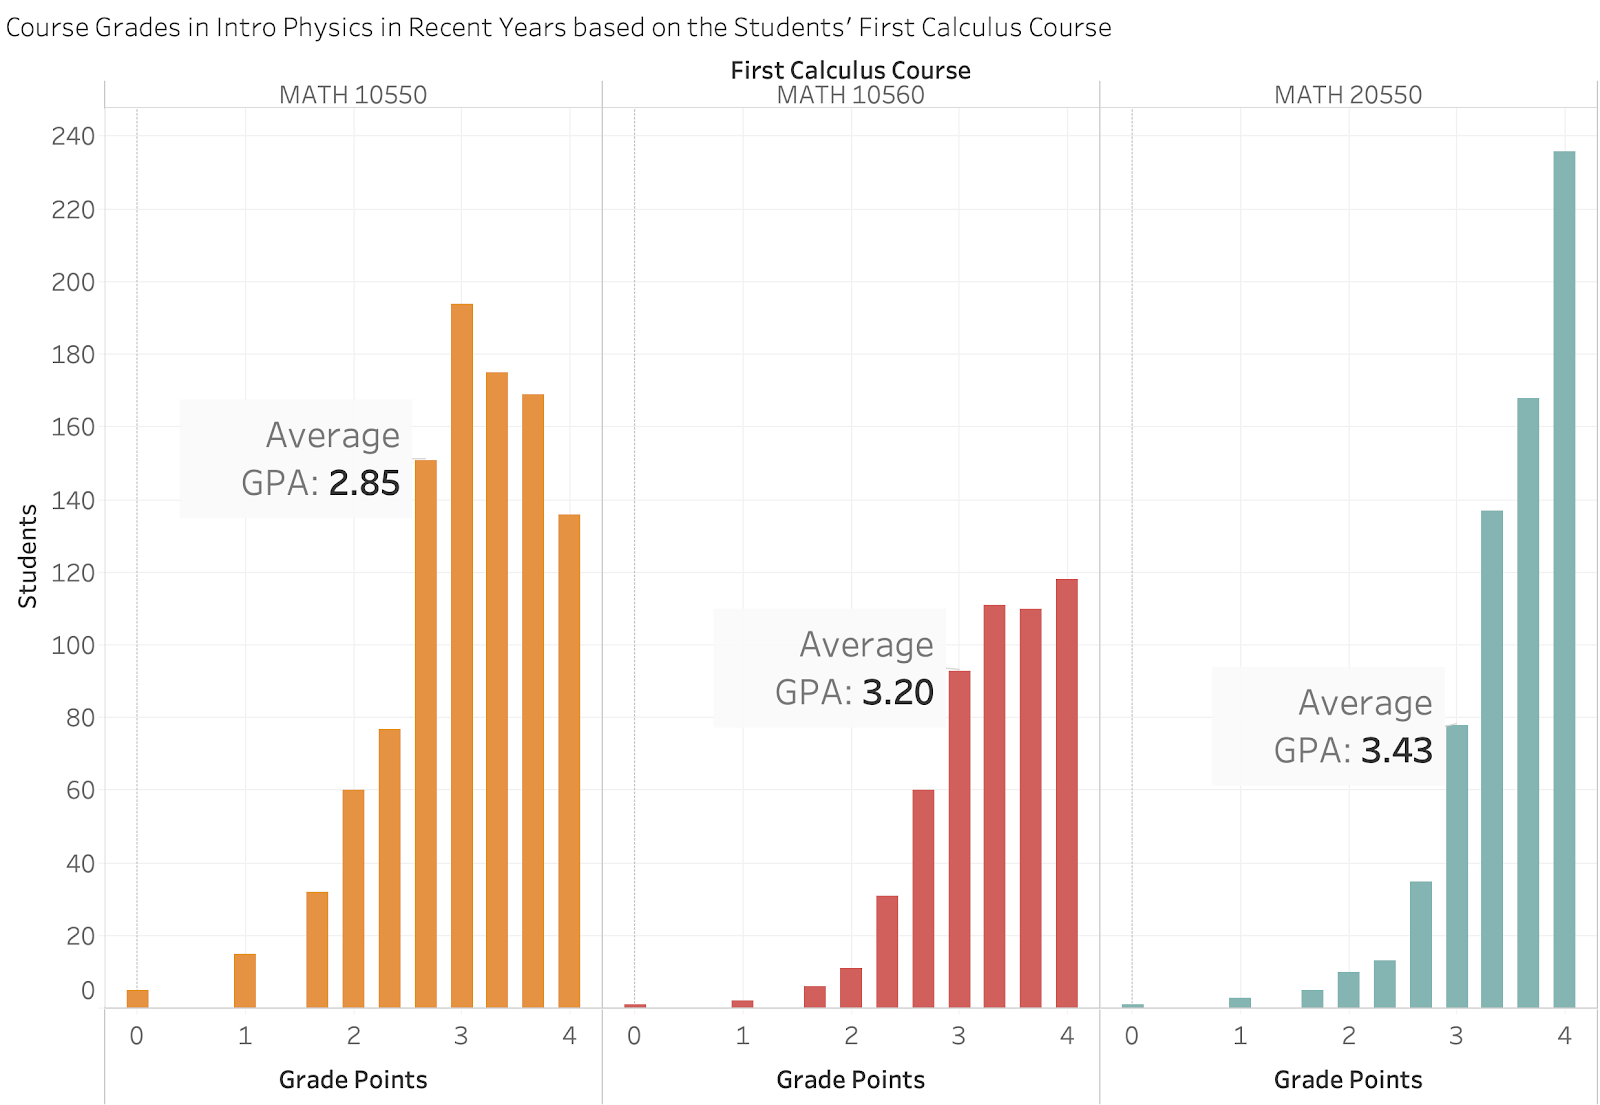
In this session, we will show how one College of Engineering used student performance data to identify and understand potential inequities in existing policy decisions. By accepting credit in required courses, in this case calculus, chemistry and physics, two groups were formed: (1) students that were ahead of the stated curriculum and (2) students that were executing the curriculum as published and expected. Looking at shared courses between these two tracks, such as physics or sophomore level engineering courses, exposed real and concerning disparities in grade performance from this policy. This session will present data from this study and describe a methodology for creating similar data analysis at other schools and within a wide range of programs.
Expanded Figures from the poster:
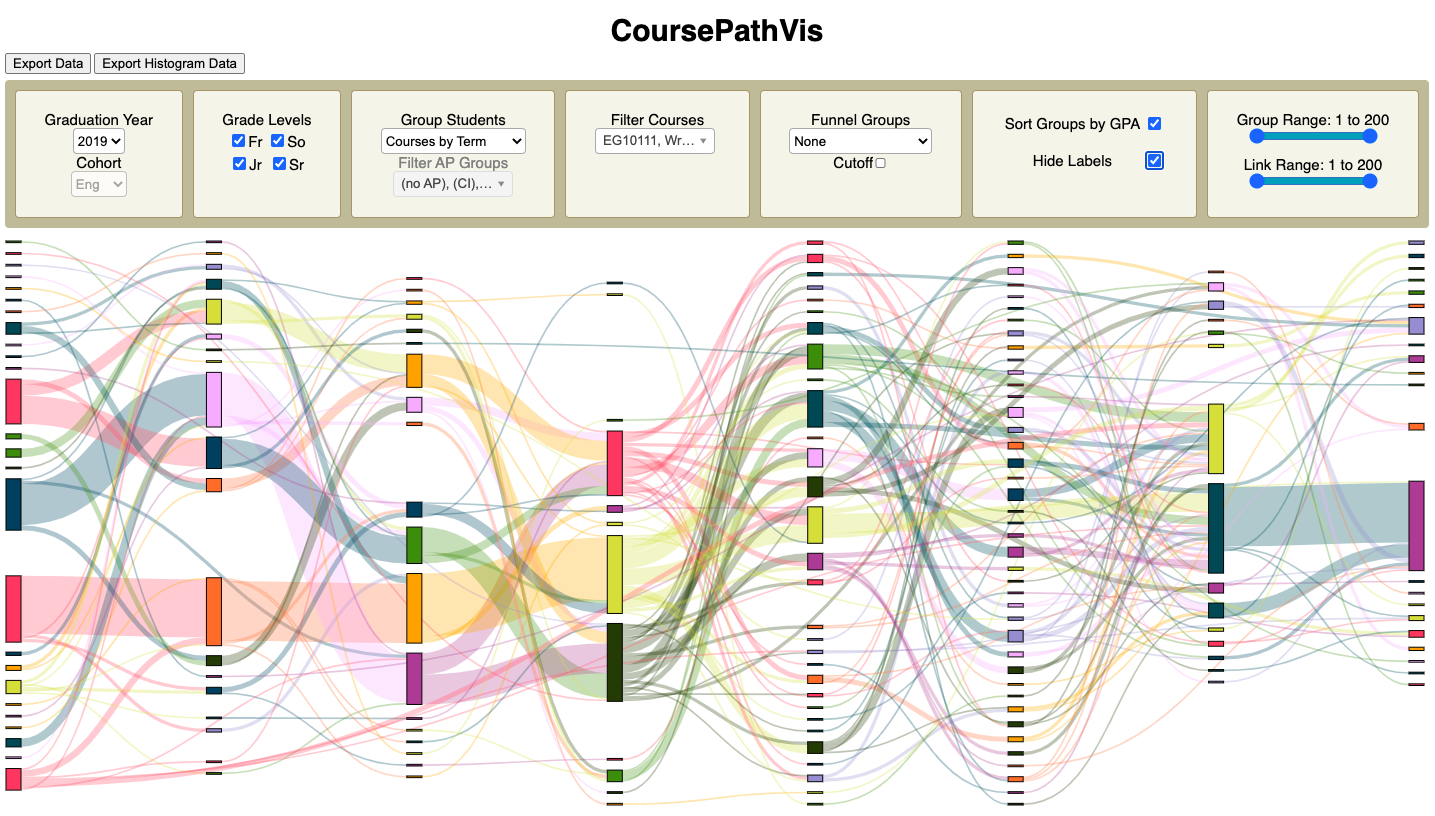
CoursePathVis is a visual analytical tool for exploring and analyzing students’ progress through a college curriculum using a Sankey diagram. We group students in multiple ways (by their AP courses, term courses, and a user-specified fun-nel course) to offer different perspectives on the underlying data. With these flexible grouping techniques and the funnel-augmented Sankey diagram, CoursePathVis helps us identify patterns or outliers that affect student success.”
Victoria Goodrich, Associate Teaching Professor, Chemical and Biomolecular Engineering
Leo McWilliams, Assistant Dean for Undergraduate Programs, College of Engineering
G. Alex Ambrose, Director of Learning Research, ND Learning | Kaneb Center for Teaching Excellence
Acknowledgements:
Andrew Craker, Pat Miller, Kevin Abbott, Kevin Barry, Alex Oxner, Augie Freda, Shelin Mathews, Ryan Snodgrass, Keith Mcindoo, Roberto Casarez, Joel Dosmann, Chaoli Wang, Brendan O’Handley, Michael Niemier, Morgan Ludwig and Samantha Allison
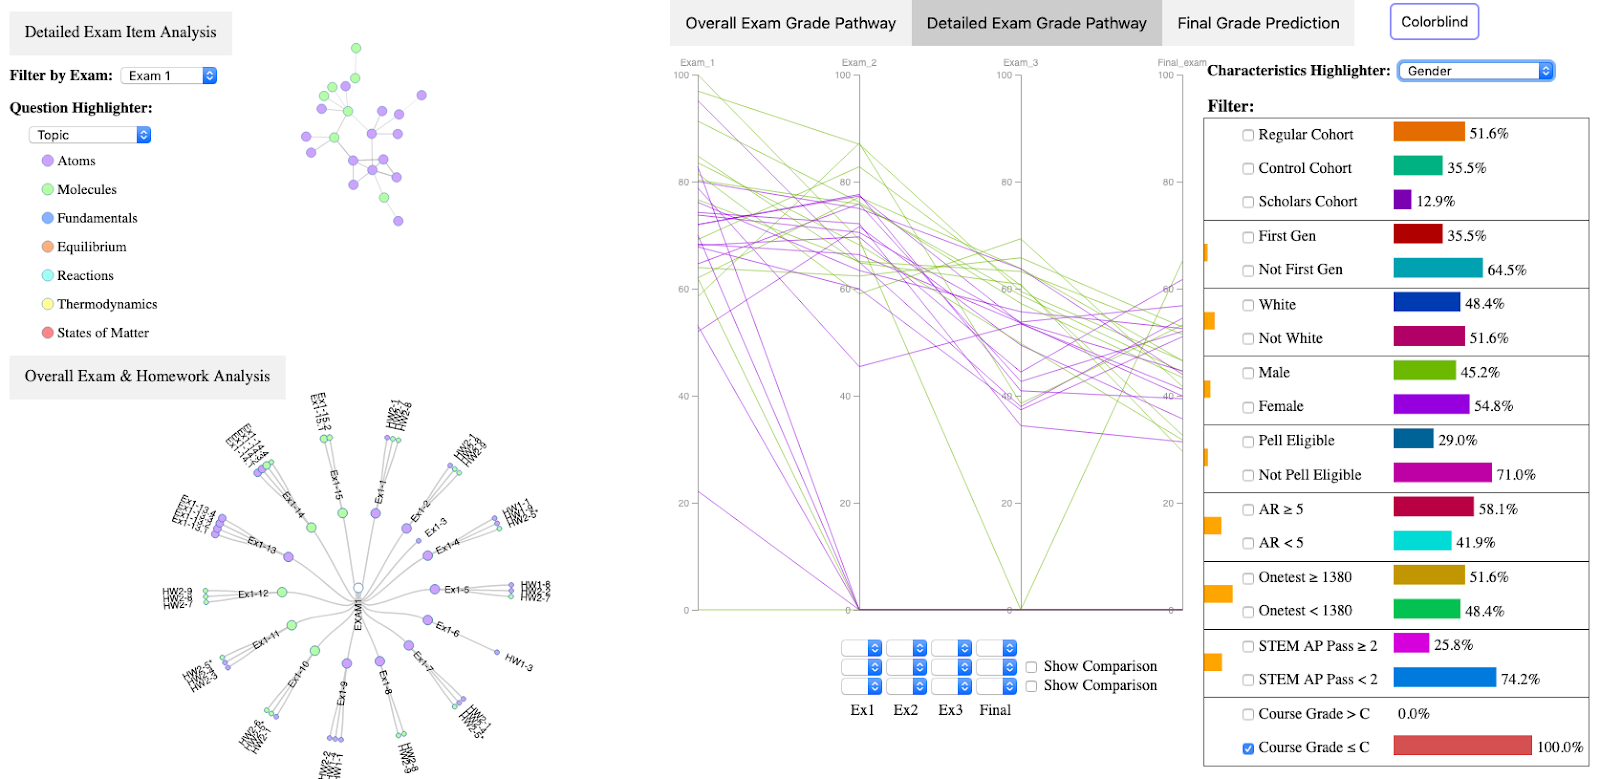
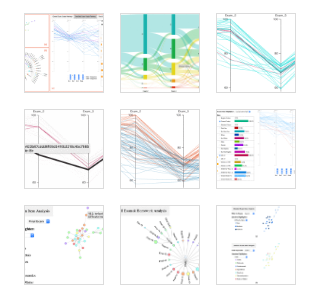
PerformanceVis is a visual analytics tool developed for analyzing and visualizing students’ chemistry course performance through the lens of time, homework and exams, and demographic and academic background. The Introduction to Chemical Principles course is a required course for all college of science and college of engineering programs at the university and is the second largest course on campus with approximately 1,000 freshmen taking the course.
This engaging tool includes four main views (overall exam grade pathway, detailed exam grade pathway, detailed exam item analysis, and overall exam & homework analysis) which are dynamically linked together for user interaction and exploration. PerformanceVis enables instructors to improve their course and assessment design by visualizing students’ perceived difficulty level and topic correlation between assignments and exams. It assists instructors and administrators in evaluating the impact of a special treatment program (cohort) by reviewing the performance of regular, control, and cohort students overall and by exam. The image below shows a screenshot of PerformanceVis with the right side of the image showing a view of the gender performance gap for those students who were not thriving. The left side of the image shows Exam 1 item analysis for each test question.
Abstract:
We present PerformanceVis, a visual analytics tool for analyzing student admission and course performance data and investigating homework and exam question design. Targeting a university-wide introductory chemistry course with nearly 1000 student enrollment, we consider the requirements and needs of students, instructors, and administrators in the design of PerformanceVis. We study the correlation between question items from assignments and exams, employ machine learning techniques for student grade prediction, and develop an interface for interactive exploration of student course performance data. PerformanceVis includes four main views (overall exam grade pathway, detailed exam grade pathway, detailed exam item analysis, and overall exam & homework analysis) which are dynamically linked together for user interaction and exploration. We demonstrate the effectiveness of PerformanceVis through case studies along with an ad-hoc expert evaluation. Finally, we conclude this work by pointing out future work in this direction of learning analytics research.
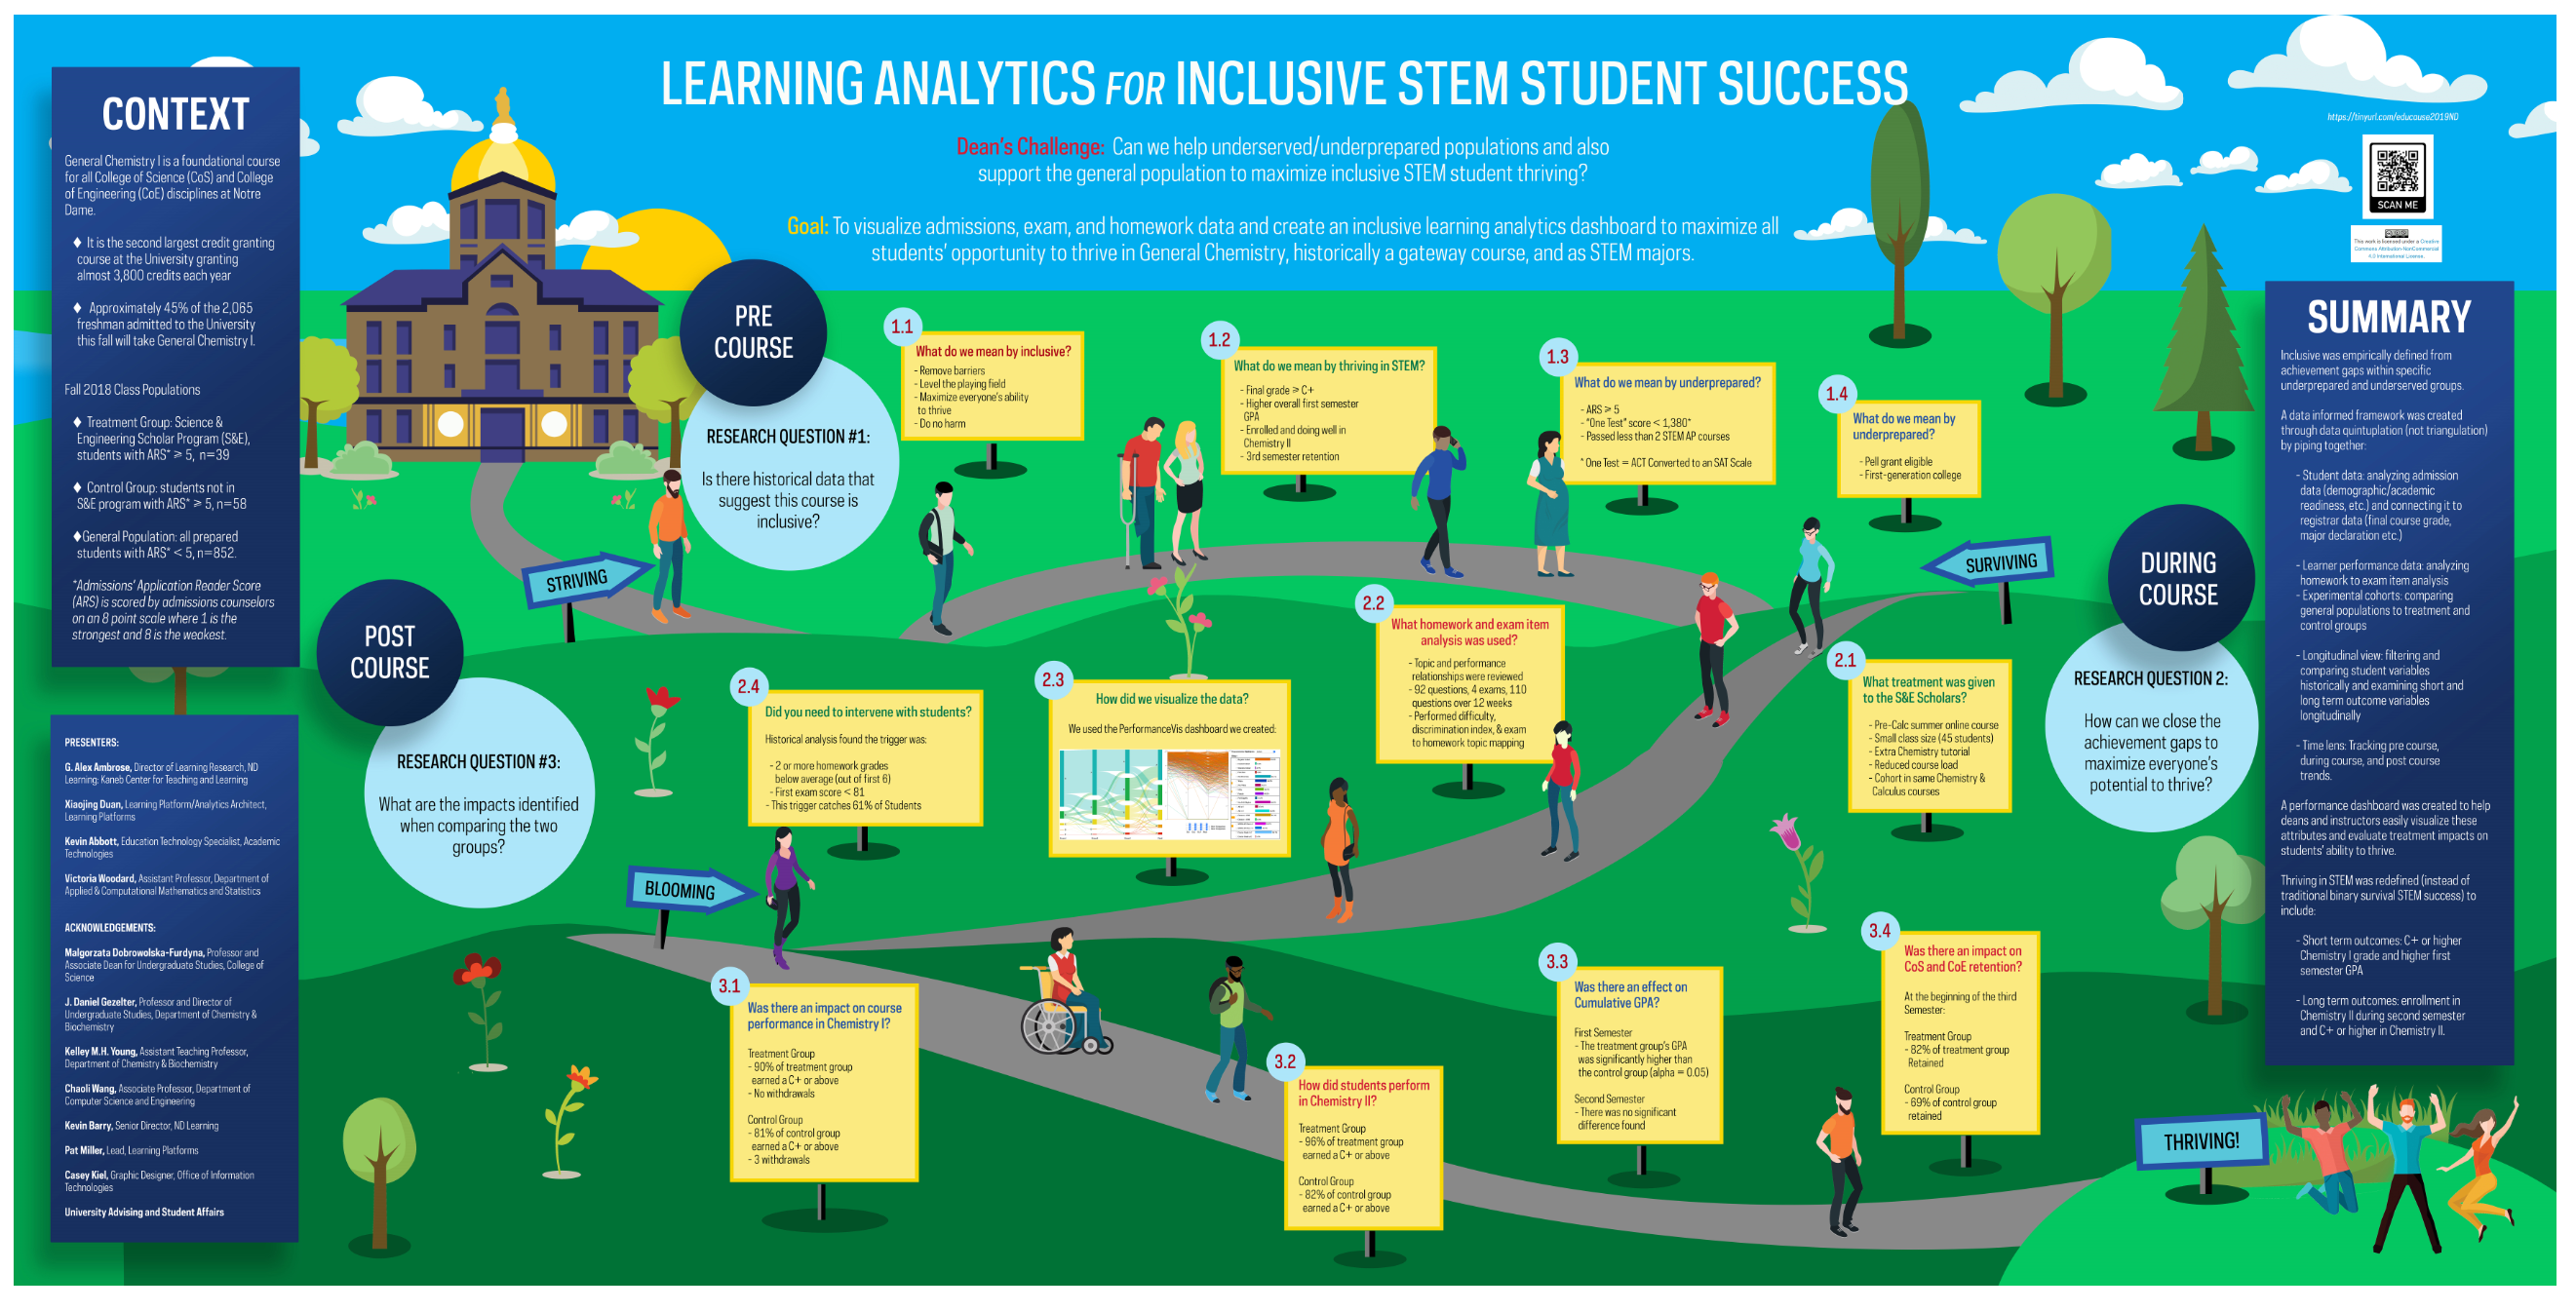
ABSTRACT: The challenge was to identify and help underserved and underprepared students in an introductory chemistry course to be retained and thrive in the college of science or engineering while supporting the general population. In this paper, we describe our methods for identifying these students, evaluating the impact of a special treatment program that was provided to a subset of those students, discuss our efforts to help the general population, and evaluate the short- and long-term impacts. In particular, we discuss a data-informed framework for analyzing student and outcome variables.
Ambrose, G. Alex, Duan, Xiaojing, Abbott, Kevin, Woodard, Victoria (2019) “Inclusive Learning Analytics to Improve STEM Student Success.” EDUCAUSE Main Conference, Chicago, IL
The goal of this project is to ensure our first year students in gateway courses are leaving Science, Technology, Engineering, and Mathematics (STEM) based majors based on a discernment decision not because they were not adequately prepared or lacked recognition of needed intervention, in courses typically consider gateways. The key questions this project is pursuing are: (1) What research, assessment, advising, and course design questions can we ask and answer from the course and student data capture that will support student success? (2) How to cross-reference student learning activity, homework analytics, and exam item analysis to help instructors improve course and assessment design? (3) Can we use analytics data to boost all students’ potential to thrive and improve stem success.
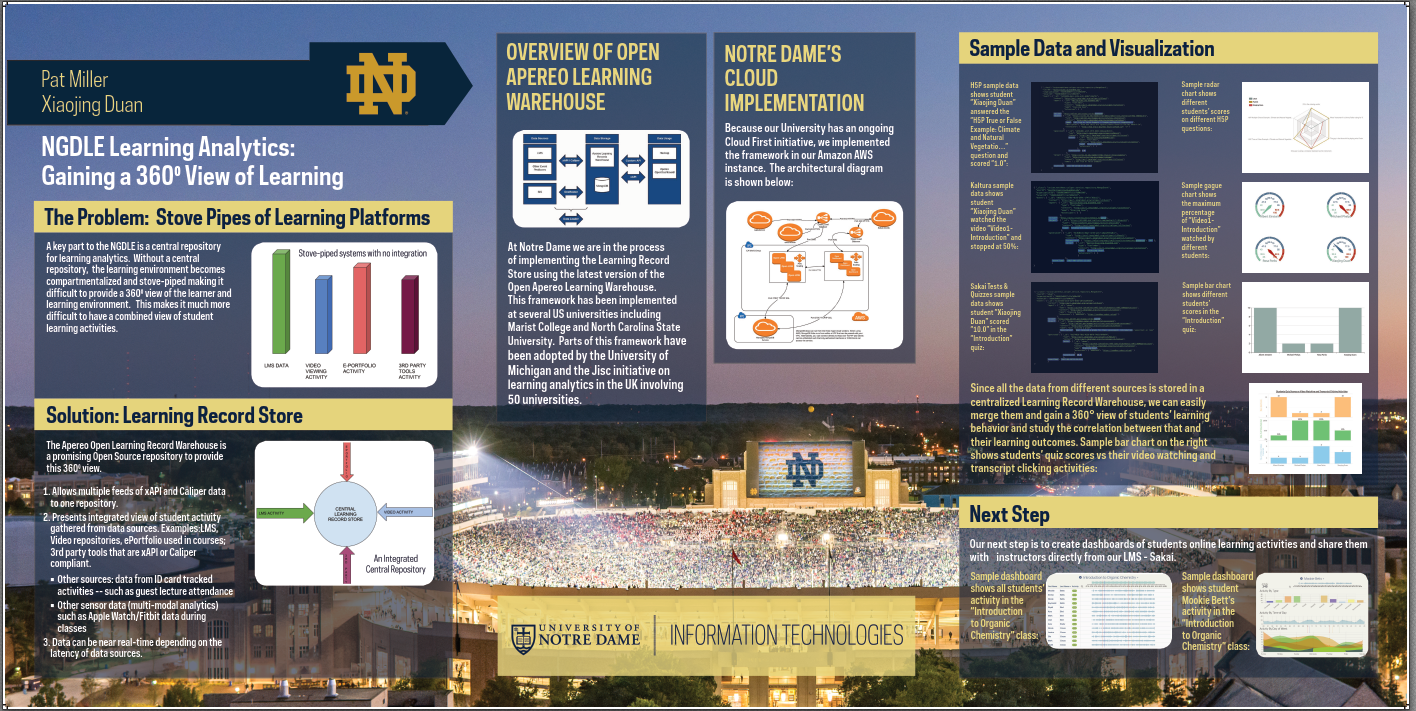
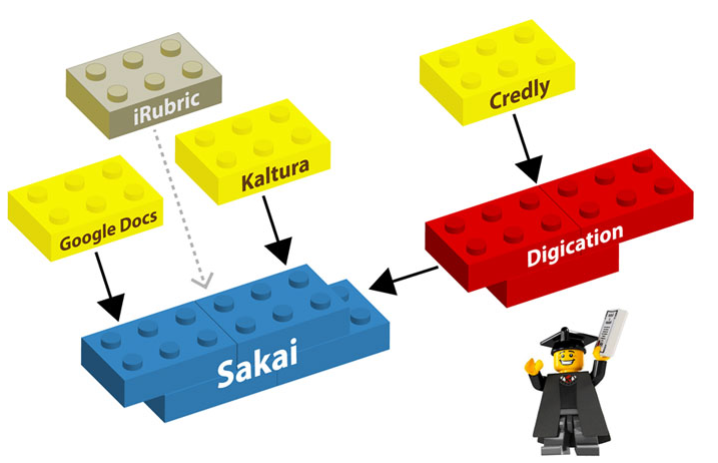
Our Chemistry courses were designed to meet that challenge and help all of our 953 (46% of all first-year student). The learning environment infrastructure was architected to follow the NGDLE interoperability, integration, analytics, advising, and learning assessment dimensions so multidimensional student data can be collected seamlessly to enable comprehensive data analysis and improvement assessment (Ambrose, Abbott, & Lanski, 2017).
Our poster will describe how we built an innovative and transparent learning environment, embedded data collection in course design, captured data from multiple sources into the centralized learning records warehouse (Miller & Duan, 2018), used predictive analytics to support students identified as underperforming to thriving, answered key questions through visualization reports, and identified what is the best and earliest predictor of student success.
Related Educause Review articles that we published on this work:
https://er.educause.edu/blogs/2018/1/ngdle-learning-analytics-gaining-a-360-degree-view-of-learning
Short Abstract: The goal of this presentation is to share our data-informed approach to re-engineer the exam design, delivery, grading, and item analysis process in order to construct better exams that maximize all students potential to flourish. Can we make the use of exam analytics so easy and time efficient that faculty clearly see the benefit?
*A first-year experience course at the University of Notre Dame offered the opportunity to develop and test a next generation digital learning environment.
*As a guiding framework for the digital architecture of the new FYE course, the design team followed the five dimensions of an NGDLE described in an ELI report to close the gaps between current learning management tools and digital learning environments.
*The FYE course required innovating beyond the supplemental course-level learning management system to create a more holistic NGDLE in order to fully support the teaching, learning, and student success missions of the program.
*Because they used an open-source LMS, they had a flexible hub with a campus support staff that could quickly, inexpensively, and safely begin to innovate at scale without high vendor cost or long development times.