Workshop: Improve your Teaching & Student Learning with Research from the Classroom

Ambrose, G. Alex, Hubert, Dan, Rouamba, Guieswende (2019) “Improve your Teaching Student Learning with Classroom Research.” Kaneb Center for Teaching Excellence Workshop, Notre Dame, IN.

Click here for the slide deck
Click here for the handout

Participants will:

  • Explore the landscape of Discipline-Based Research (DBR) and the Scholarship of Teaching and Learning (SoTL).
  • Brainstorm potential research goals, questions, and data for their own course.
    Become familiar with applied learning research support services and resources (e.g. survey/rubric design, video observation, consent forms, and umbrella IRB).


Journal Article: PerformanceVis: Visual Analytics of Student Performance Data from an Introductory Chemistry Course

Hyperlinked citation with an open acces link to full journal article:

Deng, H., Wang, X., Guo, Z., Decker, A., Duan, X., Wang, C., Ambrose, G., & Abbott, K.  (2019). PerformanceVis: Visual analytics of student performance data from an introductory chemistry course. Visual Informatics.

Abstract:
We present PerformanceVis, a visual analytics tool for analyzing student admission and course performance data and investigating homework and exam question design. Targeting a university-wide introductory chemistry course with nearly 1000 student enrollment, we consider the requirements and needs of students, instructors, and administrators in the design of PerformanceVis. We study the correlation between question items from assignments and exams, employ machine learning techniques for student grade prediction, and develop an interface for interactive exploration of student course performance data. PerformanceVis includes four main views (overall exam grade pathway, detailed exam grade pathway, detailed exam item analysis, and overall exam & homework analysis) which are dynamically linked together for user interaction and exploration. We demonstrate the effectiveness of PerformanceVis through case studies along with an ad-hoc expert evaluation. Finally, we conclude this work by pointing out future work in this direction of learning analytics research.

Keywords:
Student performance, Item analysis, Grade prediction, Learning analytics, Knowledge discovery

Figures:

VI Graphic 

Practitioner Report: Learning Analytics for Inclusive STEM Student Success

Duan, Xiaojing, Ambrose, G. Alex, Wang, Chaoli, Abbott, Kevin, Woodard, Victoria, Young, Kelley (2020) Learning Analytics for Inclusive STEM Student Success. Learning Analytics & Knowledge Conference. Practitioner Report and Poster. Frankfurt, Germany

ABSTRACT: The challenge was to identify and help underserved and underprepared students in an introductory chemistry course to be retained and thrive in the college of science or engineering while supporting the general population. In this paper, we describe our methods for identifying these students, evaluating the impact of a special treatment program that was provided to a subset of those students, discuss our efforts to help the general population, and evaluate the short- and long-term impacts. In particular, we discuss a data-informed framework for analyzing student and outcome variables.

Keywords: STEM Retention; Learning Visualization Dashboard; Inclusive Pedagogy; Learning Analytics

Click here for a current version of the practitioner report

Educause Workshop: Building Flexible Learning Spaces Utilizing Faculty & Student Driven Design

Ambrose, G. Alex (2019) ” Building Flexible Learning Spaces Utilizing Faculty & Student-Driven Design.” Educause Annual Conference, Chicago, IL

Ambrose, G. Alex (2019) ” Building Flexible Learning Spaces Utilizing Faculty & Student-Driven Design.” Educause Annual Conference, Chicago, IL

Click here for the full slide deck

Click here to enter a virtual tour of a Notre Dame typical and prototype classroom.

Abstract

The session will open with an introduction and problem identification within the context of higher education. Many IT, facilities management, and registrar units work in silos in designing, building, allocating, managing, and renovating classrooms. Additionally, the problem of missing key stakeholders’ voices (students & faculty) in the learning space design process will be defined. Next, a tour of our active learning classrooms will be provided.

An interactive presentation supported by a digital handout and backchannel will provide a history and evolution of the University of Notre Dame’s learning space research & design methodology. This approach captures faculty and student voices to create data-driven design decisions. Some of the questions we will be able to answer with our framework and tools are: How do you get faculty and student voices into the learning space design process? What do four semesters of learning space evaluation surveys from over a thousand students and dozens of faculty from multiple disciplines tell us? What can we learn from designing and testing medium Active Learning Classroom prototypes to guide future classroom design and budgets? Where do we get the most “bang for the buck” with regard to furniture, technology, or space? What are student/faculty learning space perceptions, recommendations, and impacts? Which data-driven design decisions were made to continually improve our process? What bottom-up partnerships, processes, and guidelines did we develop that were aligned to top-down strategic visions and goals?

Finally, the session will conclude with a Q&A discussion and a return to the digital handout with a review of the backchannel best questions and resource sharing.

Participants will:

  1. understand how faculty and student-driven data design can evolve their campus’ learning space design process
  2. engage in a learning space design methodology experience
  3. create a customized learning space design plan to take to their own campus

Related Posts:

IFALC Poster Presentation on our Learning Space Report Card

Steelcase Active Learning Classroom Grant Report

Photo from the Workshop in the Steelcase Interactive Room

Quick Link here: https://tinyurl.com/2019educauseND

Educause Poster: Inclusive Learning Analytics to Improve STEM Student Success

Ambrose, G. Alex, Duan, Xiaojing, Abbott, Kevin, Woodard, Victoria (2019) “Inclusive Learning Analytics to Improve STEM Student Success.” EDUCAUSE Main Conference, Chicago, IL

Click here to download the

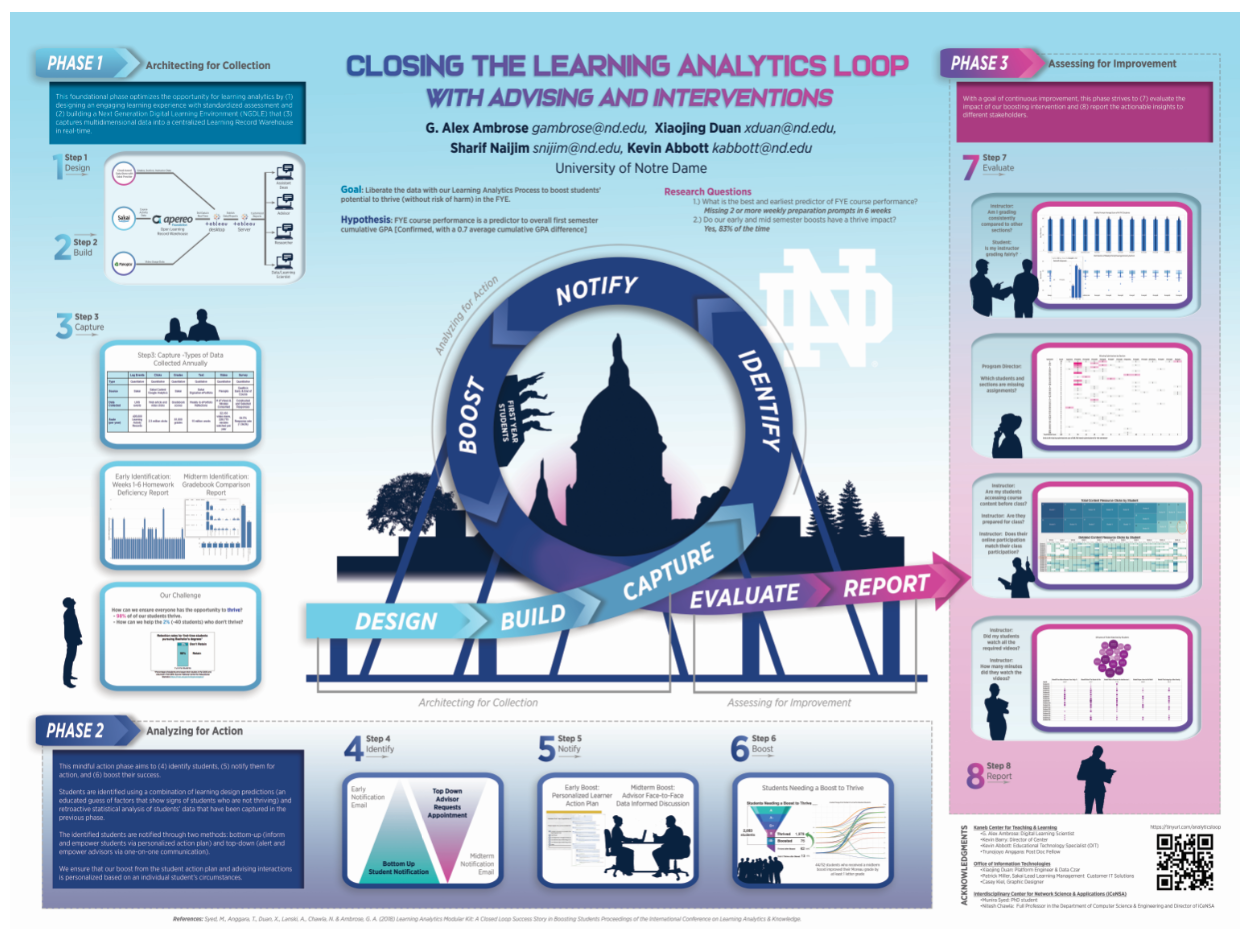
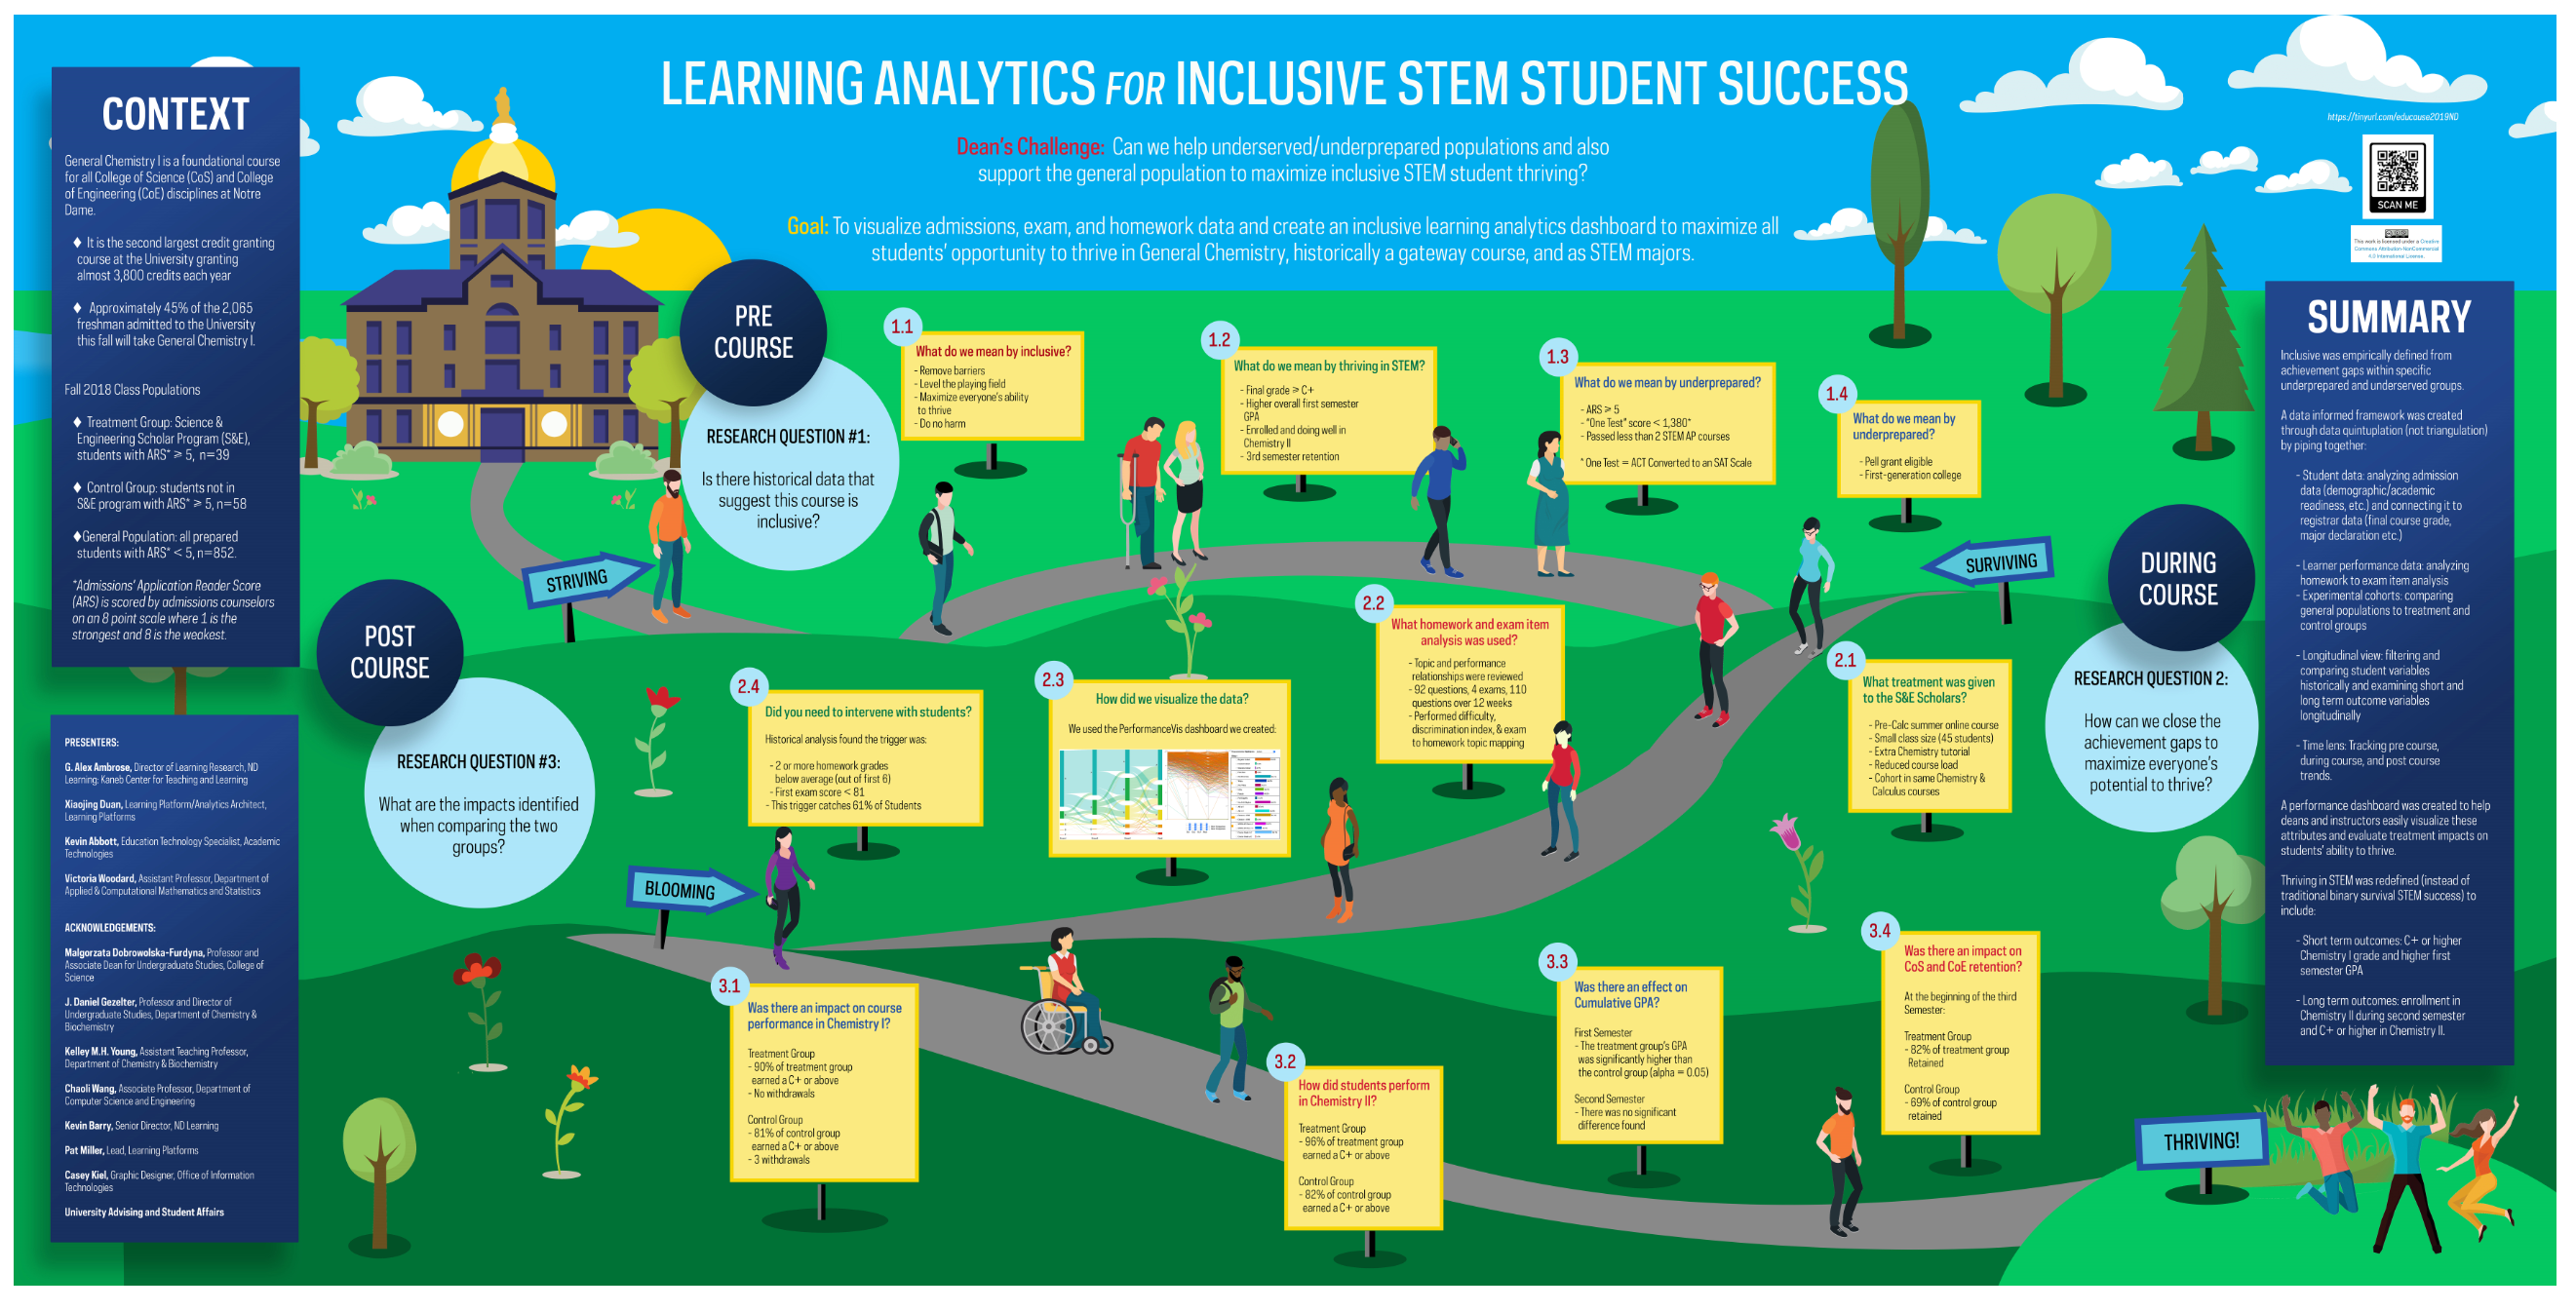
The goal of this project is to ensure our first year students in gateway courses are leaving Science, Technology, Engineering, and Mathematics (STEM) based majors based on a discernment decision not because they were not adequately prepared or lacked recognition of needed intervention, in courses typically consider gateways. The key questions this project is pursuing are: (1) What research, assessment, advising, and course design questions can we ask and answer from the course and student data capture that will support student success? (2) How to cross-reference student learning activity, homework analytics, and exam item analysis to help instructors improve course and assessment design? (3) Can we use analytics data to boost all students’ potential to thrive and improve stem success.

Our Chemistry courses were designed to meet that challenge and help all of our 953 (46% of all first-year student). The learning environment infrastructure was architected to follow the NGDLE interoperability, integration, analytics, advising, and learning assessment dimensions so multidimensional student data can be collected seamlessly to enable comprehensive data analysis and improvement assessment (Ambrose, Abbott, & Lanski, 2017).

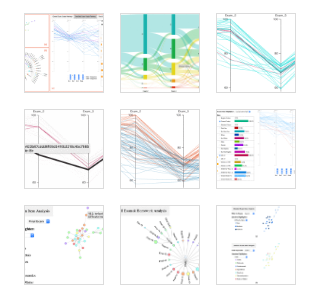
Our poster will describe how we built an innovative and transparent learning environment, embedded data collection in course design, captured data from multiple sources into the centralized learning records warehouse (Miller & Duan, 2018), used predictive analytics to support students identified as underperforming to thriving, answered key questions through visualization reports, and identified what is the best and earliest predictor of student success.

Related Educause Review articles that we published on this work:
https://er.educause.edu/blogs/2018/1/ngdle-learning-analytics-gaining-a-360-degree-view-of-learning

https://er.educause.edu/articles/2017/7/under-the-hood-of-a-next-generation-digital-learning-environment-in-progress

IFALC Poster Presentation on our Learning Space Report Card

Click here to download and zoom into the infographic poster presentation as a pdf

Click here to enter a virtual tour of a Notre Dame typical and prototype classroom.

Citation:

Ambrose, G. Alex, Burchett, Brian (Aug 2019) “Building Flexible Learning Spaces Utilizing Faculty & Student Driven Design.” International Forum on Active Learning Classrooms (IFALC), University of Minnesota.

Title:

Building Flexible Learning Spaces Utilizing Faculty & Student Driven Design

Abstract:

Many IT, facilities management, and registrar units work in silos in designing, building, allocating, managing, and renovating classrooms. Additionally, the problem of missing key stakeholders’ voices (students & faculty) in the learning space design process will be defined.

How do you get faculty and student voices into the learning space design process? Learn how faculty and student-driven data design can evolve a campus’ learning space design process. We will provide a history and evolution of the University of Notre Dame’s learning space research & design methodology, an approach which captures faculty and student voices to create data-driven design decisions. Some of the questions we will be able to answer with our framework and tools are: How do you get faculty and student voices into the learning space design process? What do four semesters of learning space evaluation surveys from over a thousand students and dozens of faculty from multiple disciplines tell us? What can we learn from designing and testing small, medium, and large Active Learning Classroom prototypes to guide future classroom design and budgets? Where do we get the most “bang for the buck” with regard to furniture, technology, or space? What are student/faculty learning space perceptions, recommendations, and impacts? Which data-driven design decisions were made to continually improve our process? What bottom-up partnerships, processes, and guidelines did we develop that were aligned to top-down strategic visions and goals?

Click here to enter a virtual tour of a Notre Dame typical and prototype classroom. You will notice the 9 key design features that shifted from the typical to the prototype classroom:
-Doubling the density occupancy data from 17.7 to 32.33 square foot per student.
-Replacing rolling single tablet armchairs with varied and flexible tables (1-5 person) and chairs.
-Switching and increasing from a single projector to 4 LCD screens.
-Switching and increasing from 1 chalkboard to 3 marker boards and 30 huddle boards.
-Reconfiguring the room from 1 fixed teaching zone to 4 flexible learning zones.
-Relocating the instructor station from tethered in the front of the room to the rear.
-Reorienting the room from a clear front of the room to no clear front of the room.
-Improving from no BYOD compatibility to floor plugs and power extension cord towers and video cables to connect to screens.

Related Posts:
Steelcase Active Learning Classroom Grant Report
Learning Space Design Experiment Ignite Talk

Steelcase Active Learning Classroom Grant Report

Ambrose, G. Alex (2019) “Building Flexible Learning Spaces Utilizing Faculty & Student Driven Design.” Steelcase Active Learning Center Grant Report

ABSTRACT
In the summer of 2017, the University of Notre Dame was awarded a $65K furniture grant from Steelcase Educations’s Active Learning Center. Notre Dame’s Office of Facilities Design and Operations contributed $50k in classroom renovation funding and the Office of Information Technologies $25K in technology funding to renovate Debartolo Hall 232 into a state-of-the-art prototype flexible classroom to maximize interactive learning. Over the next two years the team at Notre Dame developed and refined a five-step methodology to evaluate the design impact of our prototype learning space to answer five guiding research questions:

1) How do we assess and visualize the comparison of a prototype learning space to a typical classroom?

2) How were specific learning space design features perceived by faculty and students?

3) Which learning space design dimensions (furniture, technology, or environment) do faculty and students value the most?

4) What are the impacts of the learning space on faculty and students?

5) What were the major challenges and lessons learned from this learning space innovation grant?

The two biggest conclusions from our learning space report card and evaluation survey instrument were a) faculty and students in the prototype gave more than a letter grade higher (C–>B+) than their counterparts in the typical classroom b) seven out of the 9 (77%) of our design feature changes to the prototype classroom had a positive and improved effect on faculty and students.

Learning Space Design Experiment Ignite Talk

“From Learning-Centered Design & Research to Evaluating the Impact of Emerging Learning Spaces,” given on 6/19/19 at Steelcase NY, NY.

To watch the 7 min youtube video ignite recording see:

Click here to enter a virtual tour of a Notre Dame typical and prototype classroom. You will notice the 9 key design features that shifted from the typical to the prototype classroom:
-Doubling the density occupancy data from 17.7 to 32.33 square foot per student.
-Replacing rolling single tablet arm chairs with varied and flexible tables (1-5 person) and chairs.
-Switching and increasing from a single projector to 4 LCD screens.
-Switching and increasing from 1 chalkboard to 3 marker boards and 30 huddle boards.
-Reconfiguring the room from 1 fixed teaching zone to 4 flexible learning zones.
-Relocating the instructor station from tethered in the front of the room to the rear.
-Reorienting the room from a clear front of the room to no clear front of the room.
-Improving from no BYOD compatibility to floor plugs and power extension cord towers and video cables to connect to screens.

Exam Analytics in Chem-Presentation at the Midwest SoTL Conference

Ambrose, G. Alex, Duan, Xiaojing, Kanczuzewski, Kael, Young, Kelley M., & Gezelter, J. Daniel (2019) “Exams Evaluate Students: Who’s Evaluating Exams? Data-Informed Exam Design” 2019 Midwest Scholarship of Teaching and Learning Conference, Indiana University-South Bend.

[slideshare id=143091397&doc=2019sotlconferencepresentation-datainformedexamdesign-share-190501153428]


Short Abstract: The goal of this presentation is to share our data-informed approach to re-engineer the exam design, delivery, grading, and item analysis process in order to construct better exams that maximize all students potential to flourish. Can we make the use of exam analytics so easy and time efficient that faculty clearly see the benefit?


Closing the Learning Analytics Loop with Advising & Interventions – Interactive Infographic Poster Prezi, Recorded Presentation & Full Paper:

Click here to download and zoom into the infographic poster presentation as a pdf

Click here to watch on Youtube the 19 min full recorded presentation
at the Learning Analytics Conference

Click here to access the interactive infographic visual tour via Prezi
(click on the “present” button below)

For the full research paper see:

Syed, M., Anggara, T., Duan, X., Lanski, A., Chawla, N. & Ambrose, G. A. (2018) Learning Analytics Modular Kit: A Closed Loop Success Story in Boosting Students Proceedings of the International Conference on Learning Analytics & Knowledge

Abstract

Identifying non-thriving students and intervening to boost them are two processes that recent literature suggests should be more tightly integrated. We perform this integration over six semesters in a First Year Experience (FYE) course with the aim of boosting student success, by using an integrated closed-loop learning analytics scheme that consists of multiple steps broken into three main phases, as follows: Architecting for Collection (steps: design, build, capture), Analyzing for Action (steps: identify, notify, boost), and Assessing for Improvement (steps: evaluate, report). We close the loop by allowing later steps to inform earlier ones in real-time during a semester and iteratively year to year, thereby improving the course from data-driven insights. This process depends on the purposeful design of an integrated learning environment that facilitates data collection, storage, and analysis. Methods for evaluating the effectiveness of our analytics-based student interventions show that our criterion for identifying non-thriving students was satisfactory and that non-thriving students demonstrated more substantial changes from mid-term to final course grades than already-thriving students. Lastly, we make a case for using early performance in the FYE as an indicator of overall performance and retention of first-year students.

Related:

Video Story & Award Presentation Slides: Kaneb, OIT, and FYS Team win 2018 Apereo Teaching And Learning Award (ATLAS)