Once again we have a fairly boring month. The only notable change would be a 5% increase in iOS traffic on ND.edu. Tune in next month for a year-end analysis of changes and trends.
ND.edu

Traffic
- 1,380,416 views by 487,175 people
Browsers
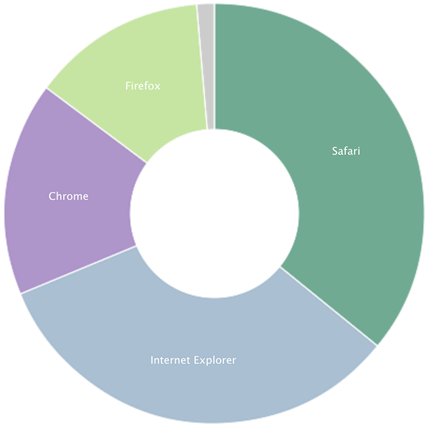
- Safari 36%
- IE 33%
- IE9 20%
- IE8 10%
- IE7 3%
- Chrome 16%
- Firefox 13%
Platforms (Overall)
- Windows 56%
- Mac 23%
- iOS 16% (+5%)
- Android 5%
Mobile Traffic
- iOS 72%
- Android 25%
m.nd.edu

Traffic
- 76,932 views by 7,424 people
- Top Content
- Athletics (+1)
- Food (-1)
- Webcams (+1)
- Map (-1)
- Events
Platforms
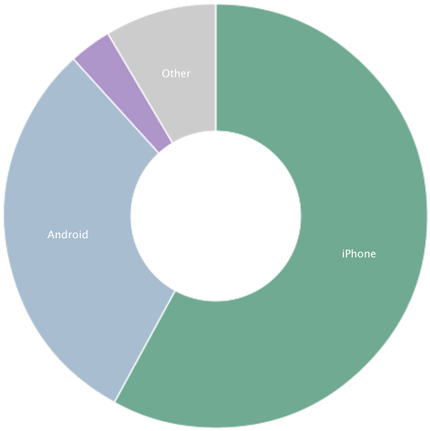
- iPhone 58%
- Android 30%
- Windows 3%
- iPod 3%
- BlackBerry 2%
- iPad 1%
Conductor

- 299 live sites (+6)
Traffic
- 3,829,560 views by 880,720 people
Browsers
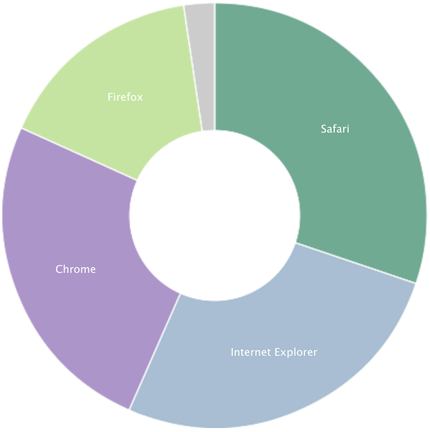
- Safari 30%
- IE 26%
- IE9 16%
- IE8 8%
- IE7 2%
- Chrome 25%
- Firefox 16%
Platforms
- Windows 56%
- Mac 27%
- iPhone 7%
- iPad 5%
- Android 3%
Stats are from Gaug.es by Github and Google Analytics.