The biggest jump this month happened on m.nd.edu where iPhone traffic went up 22%. Welcome back students!
ND.edu
Traffic
- 870,162 views by 240,044 people
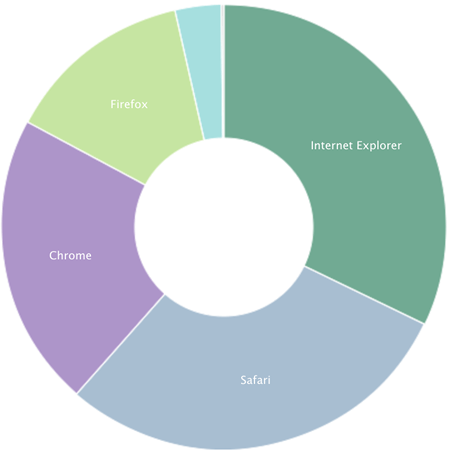
Browsers
- IE 32%
- IE9 13% (+3%)
- IE10 12%
- IE8 6%
- IE7 1%
- Safari 29%
- Chrome 21%
- Firefox 14%
Platforms (Overall)
- Windows 59%
- Mac 23%
- iOS 12%
- Android 4%
Mobile Traffic
- Total 14%
- iOS 63% (-15% since May)
- Android 17%
- Firefox OS 0.6%
- Blackberry 0.5%
- Windows Phone 0.5%
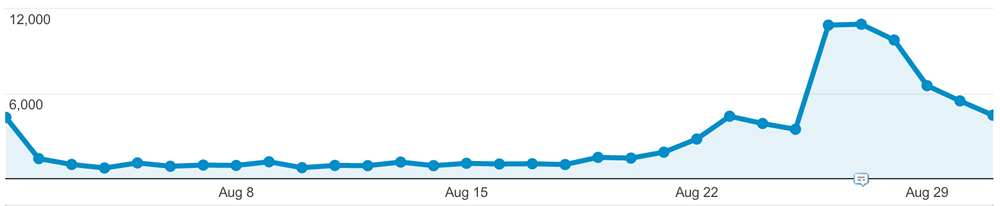
m.nd.edu
It’s fairly easy to tell from a traffic graph of m.nd.edu when students came back to campus.
Traffic
- 91,801 views by 9,047 people
- Top Content
- Map
- Academics
- Athletics
- Food
- Events
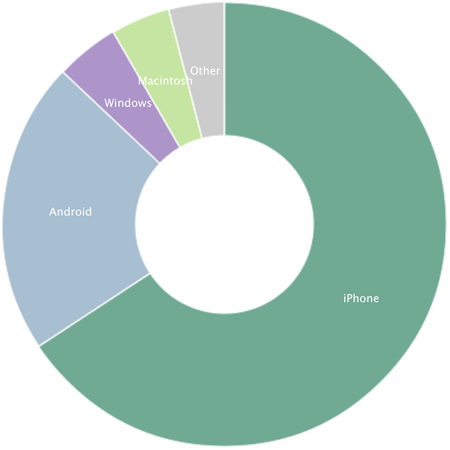
Platforms
- iPhone 66% (+22%)
- Android 21% (-11%)
- Windows 5% (-6%)
- Macintosh 4% (-4%)
- iPad 2%
- iPod 1%
Conductor
- 340 live sites (+7)
Traffic
- 3,657,781 views by 1,110,736 people
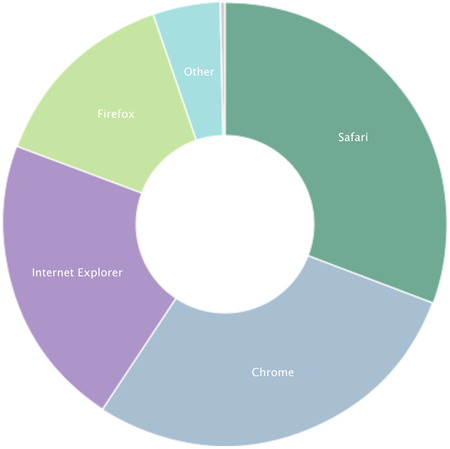
Browsers
- Safari 31%
- Chrome 29%
- IE 21%
- IE10 9%
- IE9 7%
- IE8 5%
- IE7 1%
- Firefox 14%
Platforms
- Windows 53%
- Mac 24%
- iPhone 11% (+3%)
- iPad 6%
- Android 5%
Stats are compiled from Gaug.es by Github and Google Analytics.