Better late than never, here are July’s stats. Two stats of note include a 5% increase for iOS on our ND Mobile traffic and a 3.5% increase of overall mobile traffic for Conductor.
ND.edu

Traffic
- 579,167 views by 164,114
Browsers
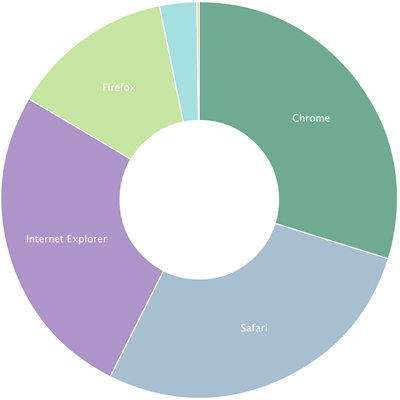
- Chrome 30%
- Safari 28%
- IE 26%
- IE11 14%
- IE9 5%
- IE10 3%
- IE8 3%
- Firefox 13%
Platforms (Overall)
- Windows 59%
- Mac 22%
- iOS 15%
- Android 4%
Mobile Traffic
- Total 18.4%
- iOS 71%
- Android 22%
- Windows 5.3%*
- Windows Phone 7.5 1%
- Blackberry 0.4%
m.nd.edu
Traffic
- 66,739 views by 6,094 people
Top Content (General)
- Dining
- Photos
- Athletics
- Map
- Academics
Top Content (Students)
- Dining
- Academics
- Map
- Photos
- Calendar
Platforms
- iOS 76% (+5%)
- Android 16%
- Windows 3%
- Macintosh 3%
Conductor

- 393 live sites
Traffic
- 3,057,979 views by 801,514
Browsers
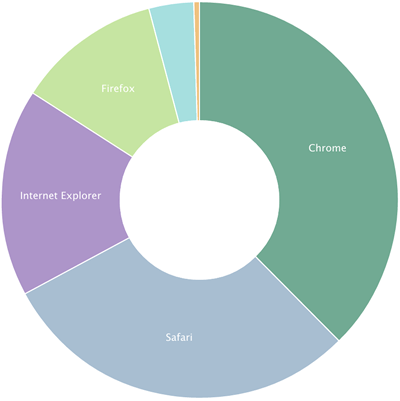
- Chrome 38%
- Safari 30%
- IE 17%
- IE11 8%
- IE9 4%
- IE10 3%
- IE8 2%
- Firefox 12%
Platforms
- Windows 52%
- Mac 24%
- iPhone 10%
- iPad 7%
- Android 6%
Mobile Traffic
- Total 29.5% (+3.5%)
- iOS 72%
- Android 22%
- Windows 8 2.9%
- Windows Phone 0.7%
- Blackberry 0.6%
Stats are compiled from Gaug.es by Github and Google Analytics.