The biggest jump this month happened on m.nd.edu where iPhone traffic went up 22%. Welcome back students! Continue reading “August 2013 Stats”
Category: Statistics
Mobile Traffic on the First Day of Classes
Inspired by a tweet by Dave Olsen of WVU, I went digging for the percentage of mobile traffic on the first day of school, going back to 2010. For fun, we’ll look at six different Notre Dame websites. Continue reading “Mobile Traffic on the First Day of Classes”
July 2013 Stats
Notable stats for July are the rise of IE10 to be the top IE, the decline of iOS on ND.edu, and the arrival of Firefox OS which now has more traffic than both Blackberry and Windows Phone. Continue reading “July 2013 Stats”
May 2013 Stats
ND.edu

Traffic
- 792,506 views by 209,417 people
Browsers
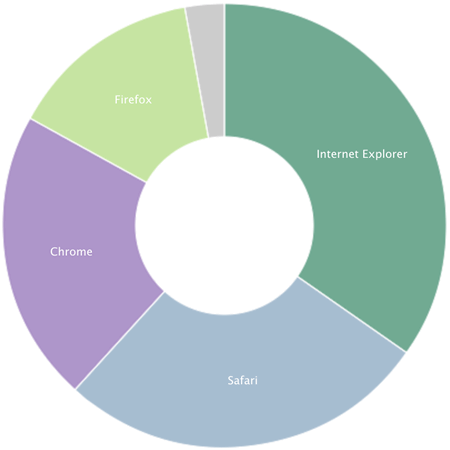
- IE 35%
- IE9 18%
- IE8 8%
- IE10 7%
- IE7 2%
- Safari 27%
- Chrome 21%
- Firefox 14%
Platforms (Overall)
- Windows 62%
- Mac 24%
- iOS 10%
- Android 2%
Mobile Traffic
- Total 13%
- iOS 78%
- Android 19%
- Blackberry 0.8%
- Windows Phone 0.7%
m.nd.edu

Traffic
- 42,394 views by 5,312
- Top Content
- Food
- Athletics
- Map
- Webcams
- News
Platforms
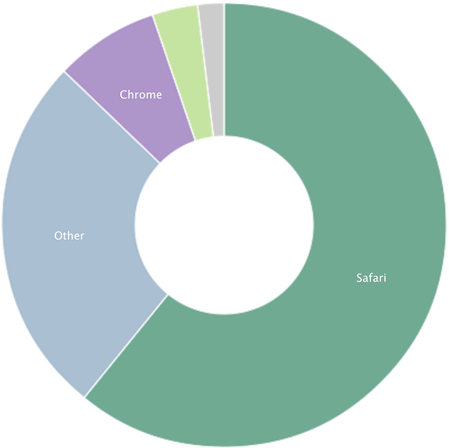
- iPhone 55% (-10%)
- Android 28% (+6%)
- Windows 6%
- Macintosh 4%
- iPad 3%
- iPod 1%
Conductor

- 325 live sites (+2)
Traffic
- 3,127,096 views by 781,798 people
Browsers
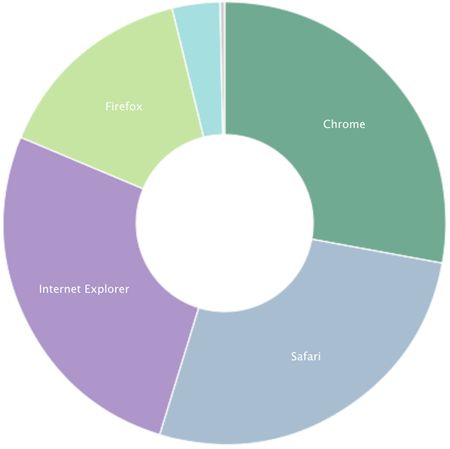
- Chrome 28%
- Safari 27%
- IE 27%
- IE9 12%
- IE10 7%
- IE8 6%
- IE7 1%
- Firefox 15%
Platforms
- Windows 58%
- Mac 25%
- iPhone 7%
- iPad 5%
- Android 3%
Stats are compiled from Gaug.es by Github and Google Analytics.
April 2013 Stats
It’s been a quiet month. Browser stats are back to normal on m.ND.edu. IE10 made its debut on the ND.edu stats jumping in with 4%. Everything else was pretty steady from last month. Continue reading “April 2013 Stats”