Better late than never, we present the first months stats of 2013. The most interesting stat of the month is that while MacOS makes up 21% of platform traffic on ND.edu, iOS isn’t far behind with 19%. Contrast that with our Conductor sites where iOS totals 12% (for 308 sites).
ND.edu

Traffic
- 1,447,230 views by 504,006 people
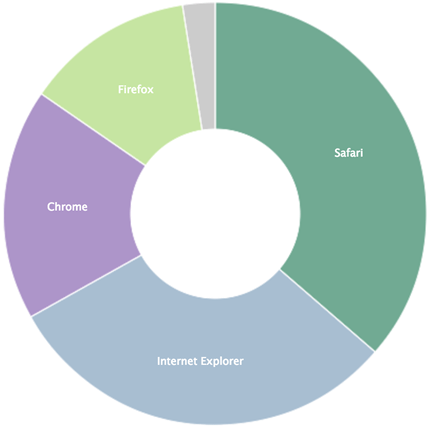
Browsers
- Safari 36%
- IE 31%
- IE9 18%
- IE8 9%
- IE7 2%
- Chrome 18%
- Firefox 13%
Platforms (Overall)
- Windows 54%
- Mac 21%
- iOS 19% (+3%)
- Android 6%
Mobile Traffic
- Total 24%
- iOS 74%
- Android 24%
- Blackberry 1%
- Windows Phone 0.6%
m.nd.edu

Traffic
- 75,900 views by 7,998 people
- Top Content
- Food (+1)
- Athletics (-1)
- Webcams
- Map
- Academics (+1)
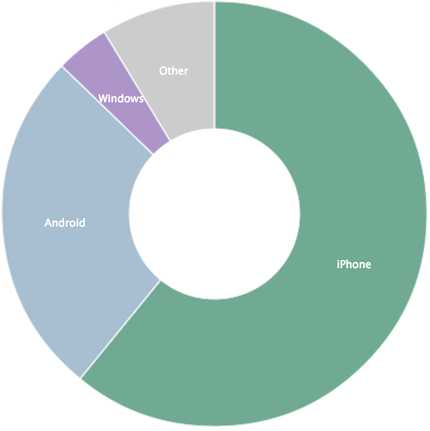
Platforms
- iPhone 58% (+3%)
- Android 26% (-4%)
- Windows 4%
- Macintosh 3%
- iPod 3%
- iPad 2%
- BlackBerry 1%
Conductor

- 308 live sites (+9)
Traffic
- 3,866,802 views by 958,304 people
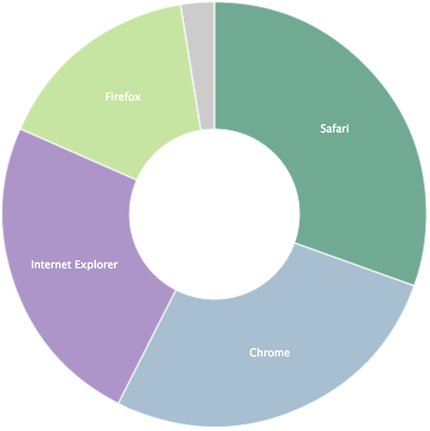
Browsers
- Safari 30%
- Chrome 27%
- IE 24%
- IE9 15%
- IE8 7%
- IE7 2%
- Firefox 16%
Platforms
- Windows 55%
- Mac 28%
- iPhone 7%
- iPad 5%
- Android 3%
Stats are from Gaug.es by Github and Google Analytics.