This month we saw a significant drop in mobile traffic and rise in desktop traffic. This is due to last months huge jump in mobile usage from the BCS bowl game traffic.
ND.edu
Traffic
- 889,240 views by 237,849 people
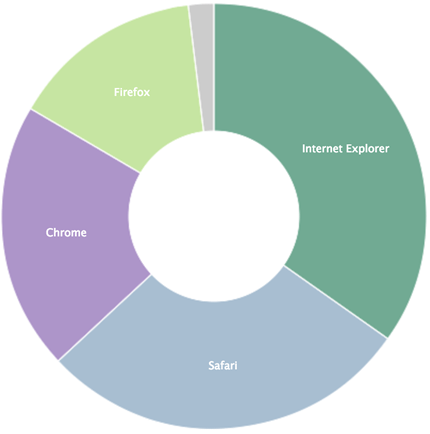
Browsers
- IE 35%
- IE9 22% (+4%)
- IE8 9%
- IE7 3%
- Safari 28% (-8%)
- Chrome 20%
- Firefox 15%
Platforms (Overall)
- Windows 61% (+7%)
- Mac 26% (+5%)
- iOS 9% (-10%)
- Android 2%
Mobile Traffic
- Total 11%
- iOS 78%
- Android 20%
- Blackberry 0.9%
- Windows Phone 0.6%
m.nd.edu
Traffic
- 71,385 views by 5,442 people
- Top Content
- Food (+1)
- Webcams (+1)
- Athletics (-1)
- Map
- Weather
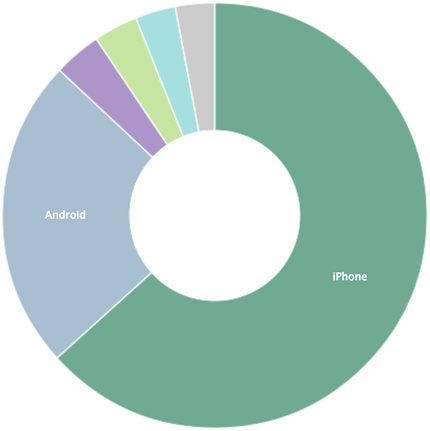
Platforms
- iPhone 63% (+5%)
- Android 24%
- Windows 4%
- iPad 3%
- Macintosh 3%
- iPod 2%
- BlackBerry 1%
Conductor
- 314 live sites (+6)
Traffic
- 3,373,488 views by 741,572 people
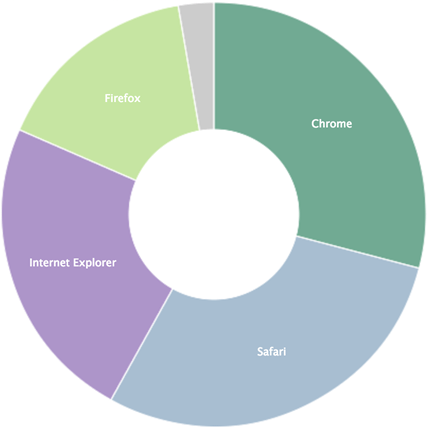
Browsers
- Chrome 29%
- Safari 29%
- IE 23%
- IE9 15%
- IE8 6%
- IE7 1%
- Firefox 16%
Platforms
- Windows 56%
- Mac 30%
- iPhone 6%
- iPad 5%
- Android 2%
Stats are from Gaug.es by Github and Google Analytics.