A joint effort between the Office of Information Technologies (OIT) and University Communications resulted in the decision to migrate the Notre Dame website to the Amazon Web Services (AWS) system. Continue reading “Our Head is in the Clouds”
Author: Erik Runyon
Gameday Bump
It’s always interesting to watch stats around football weekends as there’s usually a pretty big spike whether it’s home or away. Last night Notre Dame football played in its biggest game in my 5+ years at the university. And even though the game didn’t end in a way any of us here wanted, the stats themselves are quite fun. Below are graphs for the past 24 hours from the main site, our mobile site, the map and Conductor (the campus CMS). Continue reading “Gameday Bump”
2012 Stats Review
We’re taking a break from our monthly stats review to take a look back on some key changes that happened over the course of the year. Continue reading “2012 Stats Review”
November 2012 Stats
Once again we have a fairly boring month. The only notable change would be a 5% increase in iOS traffic on ND.edu. Tune in next month for a year-end analysis of changes and trends. Continue reading “November 2012 Stats”
October 2012 Stats
October may very well be the most boring numbers month of the year. Most percentages didn’t change at all, and those that did were mostly by only 1%.
ND.edu

Traffic
- 1,245,106 views by 411,201 people
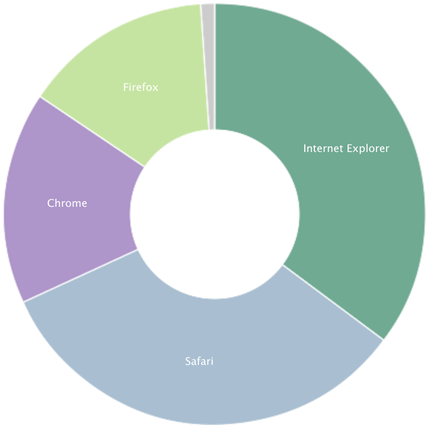
Browsers
- IE 35%
- IE9 20%
- IE8 12%
- IE7 3%
- Safari 33%
- Chrome 16%
- Firefox 14%
Platforms (Overall)
- Windows 59%
- Mac 24%
- iOS 11%
- Android 4%
Mobile Traffic
- iOS 72%
- Android 25%
m.nd.edu

Traffic
- 81,157 views by 7,597 people
- Top Content
- Food
- Athletics
- Map
- Webcams
- Events
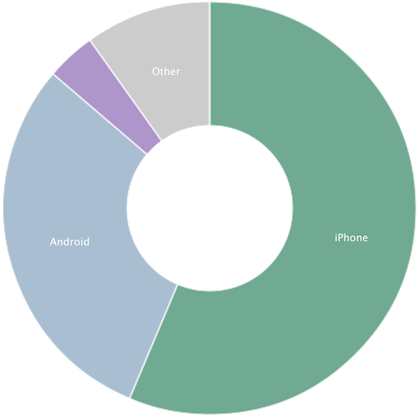
Platforms
- iPhone 56%
- Android 30%
- Windows 4%
- iPod 3%
- BlackBerry 2%
- iPad 2%
Conductor

- 293 live sites (+8)
Traffic
- 3,955,973 views by 865,820 people
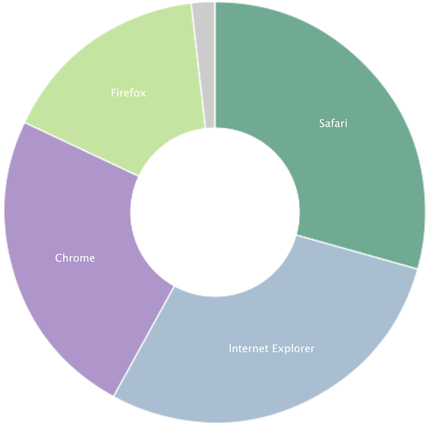
Browsers
- Safari 29%
- IE 29%
- IE9 16%
- IE8 9%
- IE7 3%
- Chrome 24%
- Firefox 16%
Platforms
- Windows 58%
- Mac 27%
- iPhone 6%
- iPad 5%
- Android 3%
Stats are from Gaug.es by Github and Google Analytics.