September 7, 2023
The goal of this workshop was to discuss assumptions that go into how wastewater data is adjusted and why data are adjusted with a focus on effects that happen before a sample is collected. Participants were asked to imagine a scenario in which there is limited information about “Pathogen Z” and how prevalent it is in the community.
A recording to the introduction presentation and discussion reporting is linked here.
They were asked to think about the following:
- What factors will affect your sample before you collect it?
- Will those factors affect geographic or temporal comparability?
- How can you reduce those sources of variability?
The workshop discussion focused on in-sewer effects (first two panels in Figure 1) as the types of controls to adjust for method variability are well described.
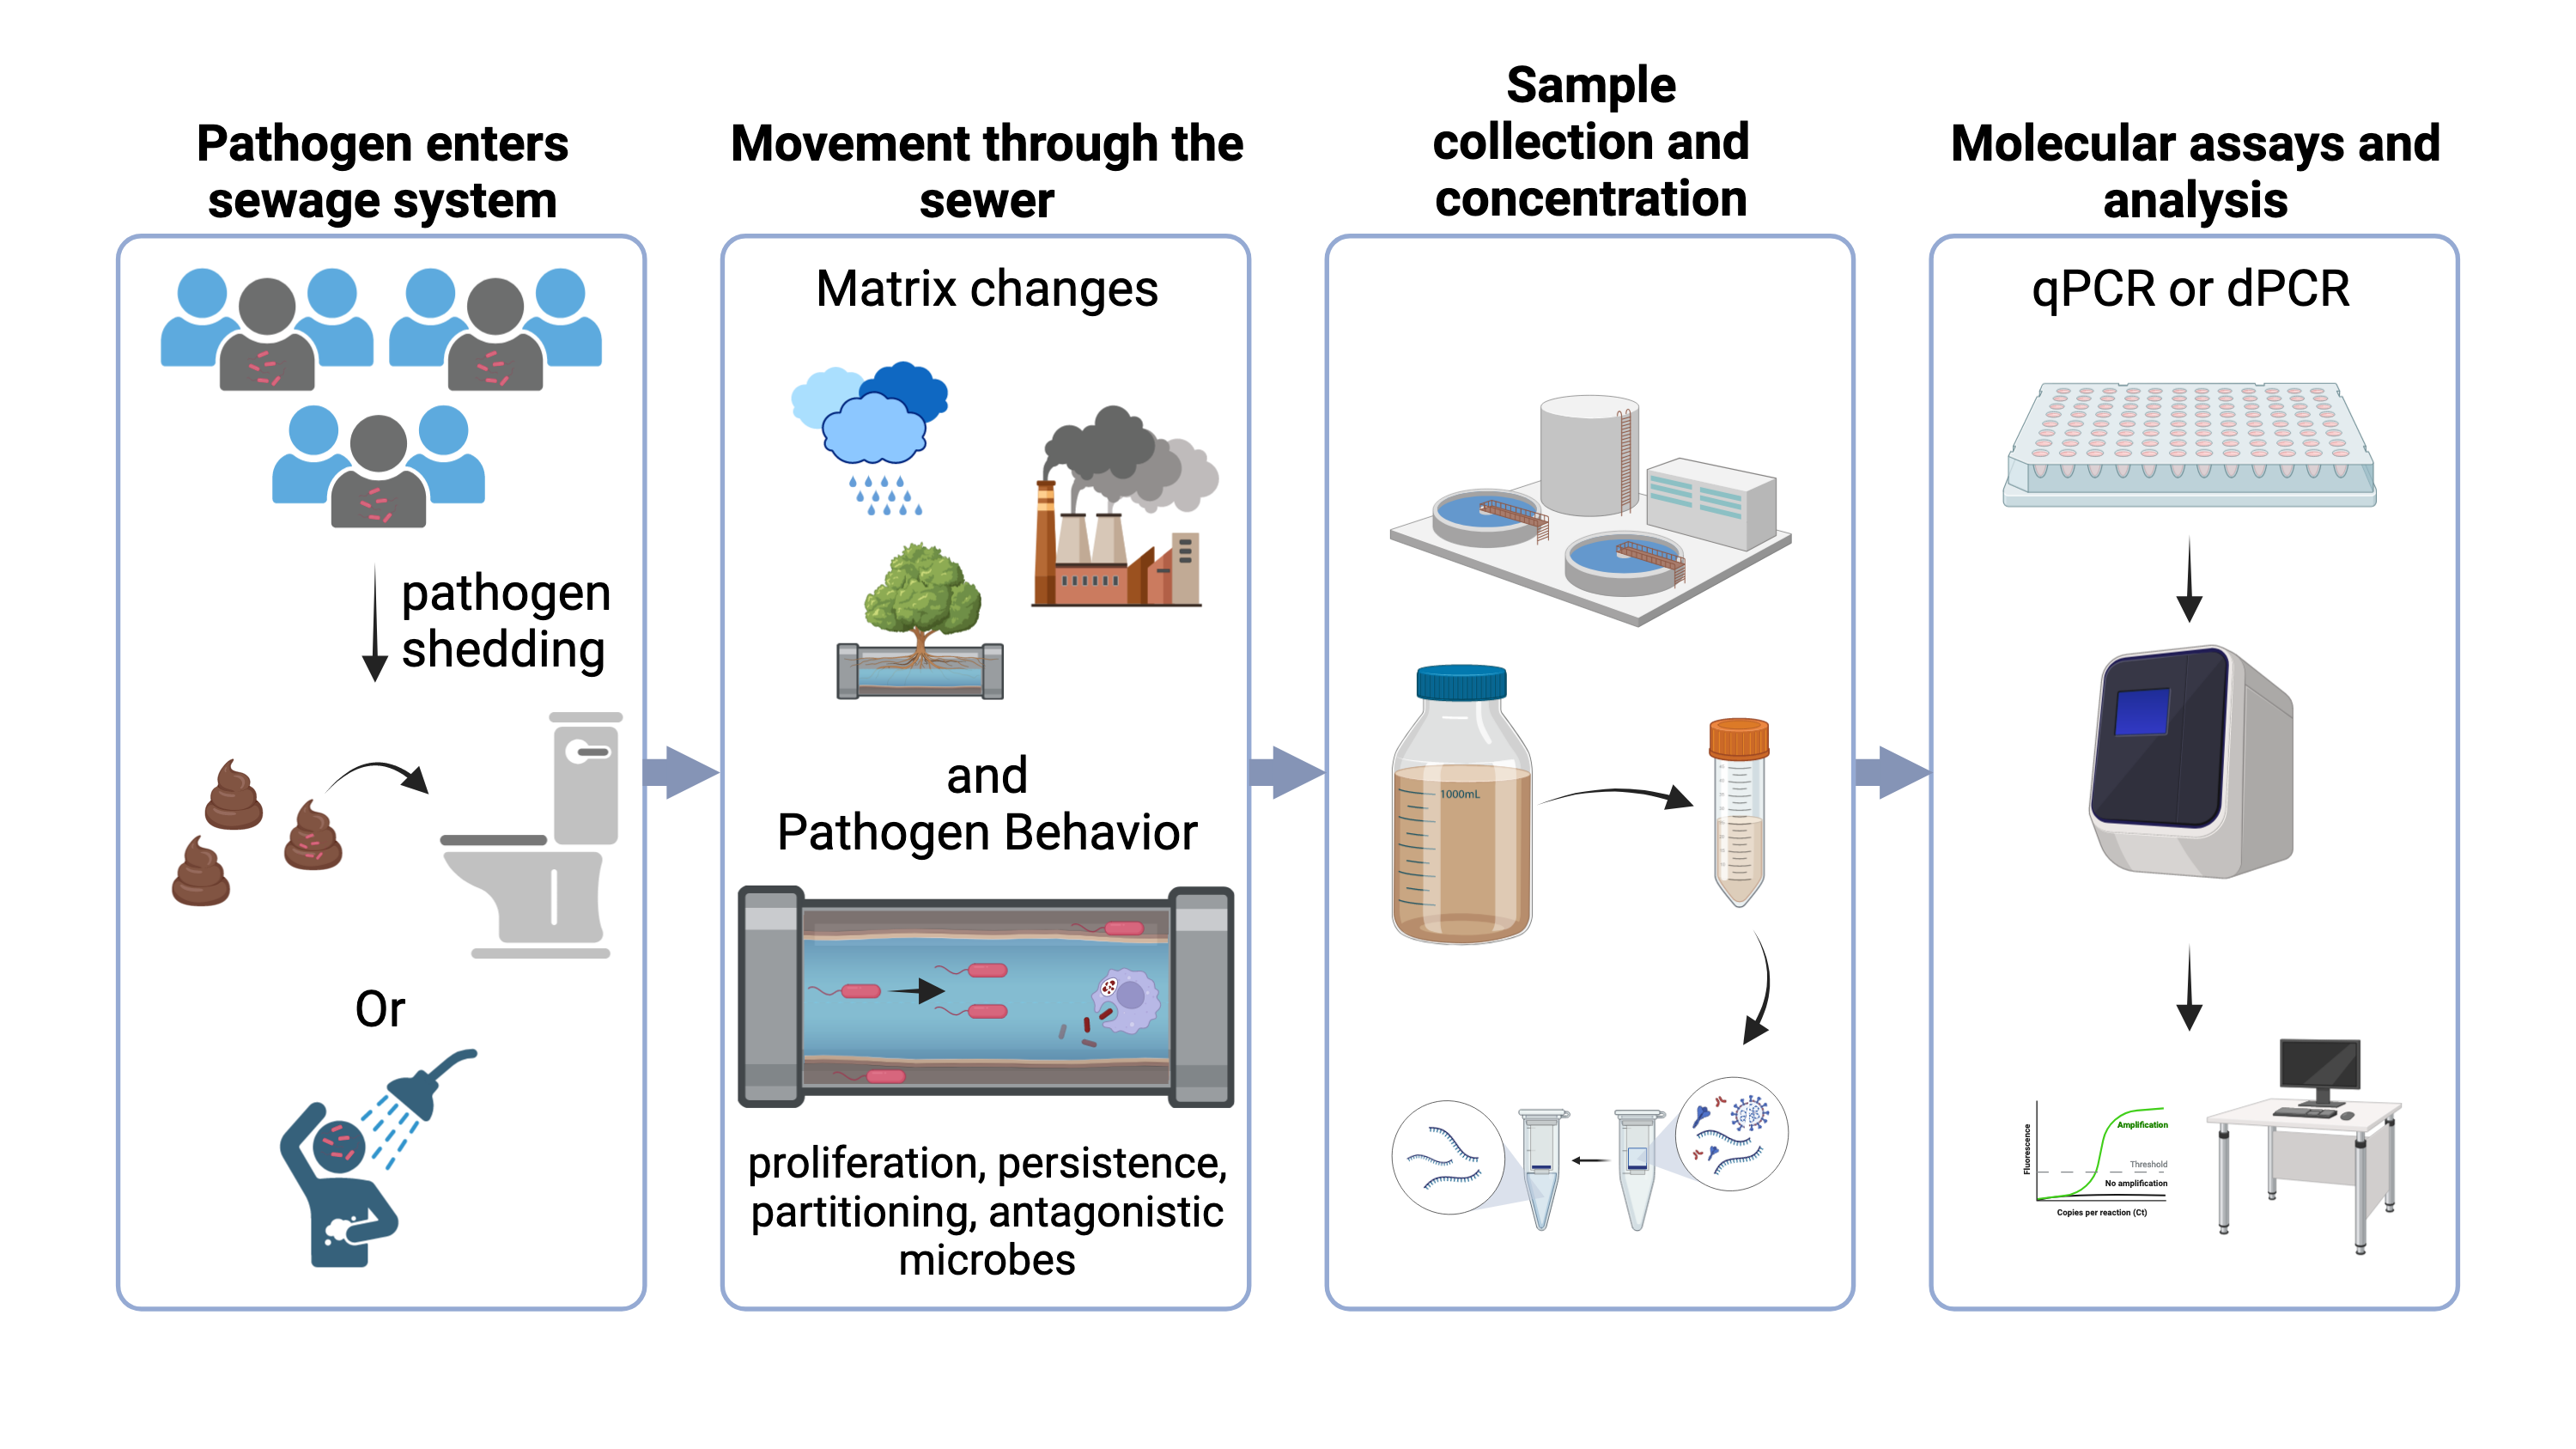
Figure 1: Different phases of wastewater based epidemiology. Created with Biorender.com
After introducing the scope of the workshop, participants were put into breakout rooms where they completed the following activity:
Part 1:
Please discuss the following in the context of controlling for population effects and in-sewer effects
before you collect your sample. The goal is to try to better illuminate the underlying population of people shedding “Pathogen Z”, either symptomatic, asymptomatic, or pre/post-symptomatic. Try to avoid talking about method recovery controls, PCR controls, inhibition controls, etc. Try to put yourself in a situation where you’re designing a WBE program for a newly discovered “Pathogen Z”. There is little available clinical data to validate your wastewater data, so you need to make hypothesis driven choices to adjust the wastewater data.
- What types of adjustments do you make to your data to make comparisons? What types of comparisons are valid with those adjustments (e.g., temporal)?
- What assumptions are you making to carry out data adjustments? For example, “I adjust by daily influent flow because it proportionally accounts for dilution in my wastewater system”
- What hypotheses drive your assumptions?
- How could you test these hypotheses?
- Below are some factors you may consider wanting to use to adjust your measurements:
- Adjust for differences in the matrix of the sample collected (dilution, people contributing to the sample, etc.)
- Adjust for the in-sewer effects of Pathogen Z fate and transport (adsorption, persistence, partitioning, etc.)
- Are there other effects related to factors prior to sample collection that should be considered?
Part 2:
You need to pick criteria to adjust your data for these categories to try to incorporate the factors above to improve the precision of the prevalence estimate of Pathogen Z in the community you are sampling. What are the ideal criteria to select normalization controls for these two types of adjustments? Please fill out the table with these “ideal criteria”. Some criteria may not apply to both adjustments while others will. A few criteria have been listed below to get you started, but please add/change/delete as you see fit.
| Sample and Population Differences | In-sewer effects |
| Limited non-human sources Stable in wastewater Little seasonal variation | Similar biological structure as Pathogen Z (enveloped vs. non enveloped, gram (+) vs gram (-)) Partitions with Pathogen Z (solids vs liquids) |