Hello all!
Thank you all very much for the participation in this study and making it possible. Most of the samples have been measured and results have been sent back to people. Unfortunately, some received samples did not contain enough material for measurement.
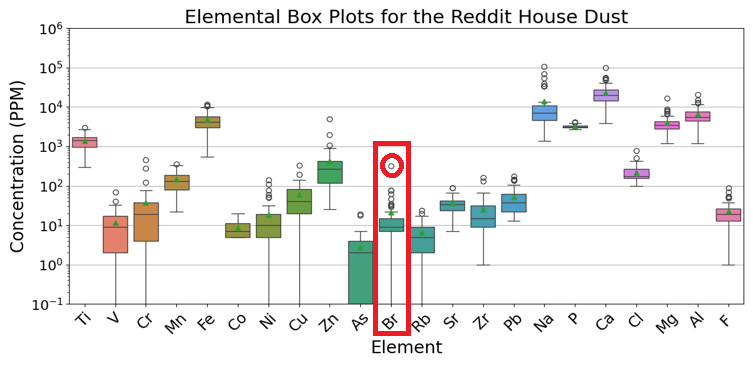
This update will show some strengths of this type of study/measurement technique. First one of the major strengths is the ability for participants to help explain outlier or unusual results. One example of this is highlighted below with the element bromine (Br). The highest sample measured is circled in red and was about 10x higher than the average. The participant noticed this and informed us that they use brominated salts in a hot tub which could very well be the cause of this extremely large measurement.

For some reference/help reading a box plot, the Wikipedia article has information on what the boxes represent Box plot – Wikipedia.
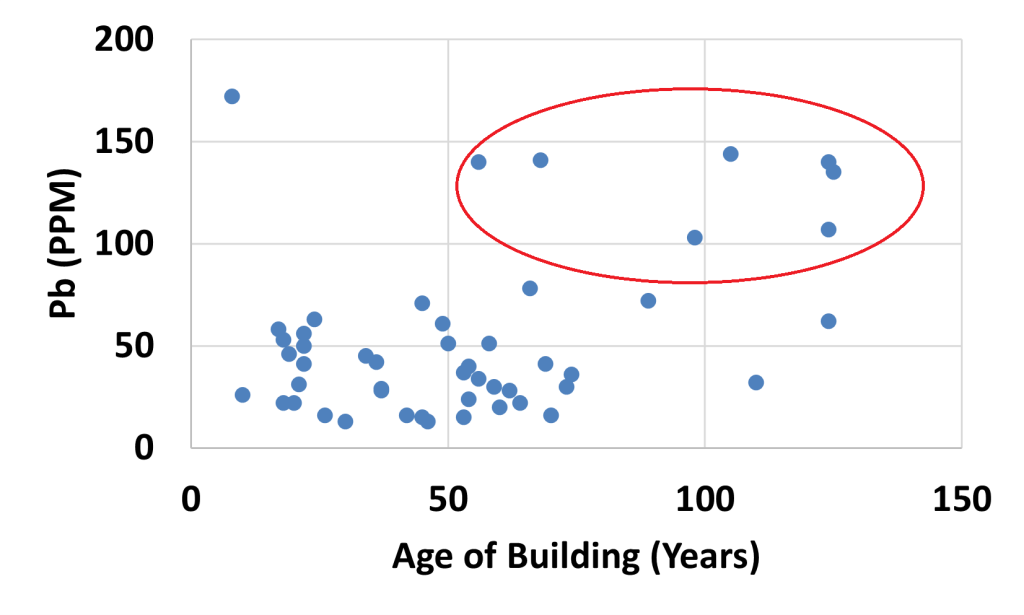
In addition, we can use the address provided to determine the age of the building. This can be plotted with the lead concentration to see how the age of the building is related to the concentration of lead in the vacuum dust. This is a well-known relationship due to the lead paint only being present in some older buildings before it was banned in the 70s. Below we can see the plot showing that most of the largest concentrations of lead measured were from older buildings.

Each blue dot is a sample measurement and the ones circled in red are the largest concentrations of lead measured and building constructed before lead paint was banned. This was expected and shows that our technique works well and agrees with other measurement methods. There is one sample with large amounts of lead built very recently but the source of this lead is currently unknown.
These are some of the interesting results from this study and the rest has been written up in my PhD dissertation. Some may be put into a publication as well at a later date. Thank you again for your interest and participation in the study allowing this to be possible!