Camp PEON Day 6: LAST DAY

We wrapped up the last day with age-depth models and independent project presentations.
keepclam
3 classical age models include linear interpolation (connect the dots), regression (linear or polynomial), and smooth spline. If you use classical age models, CLAM (classical age models) is an R package that is good step forward.

The field is moving away from classical models and starting to use Bayesian Age Models (started in the mid-1990s). The age model we discussed and applied to actual data is BACON.

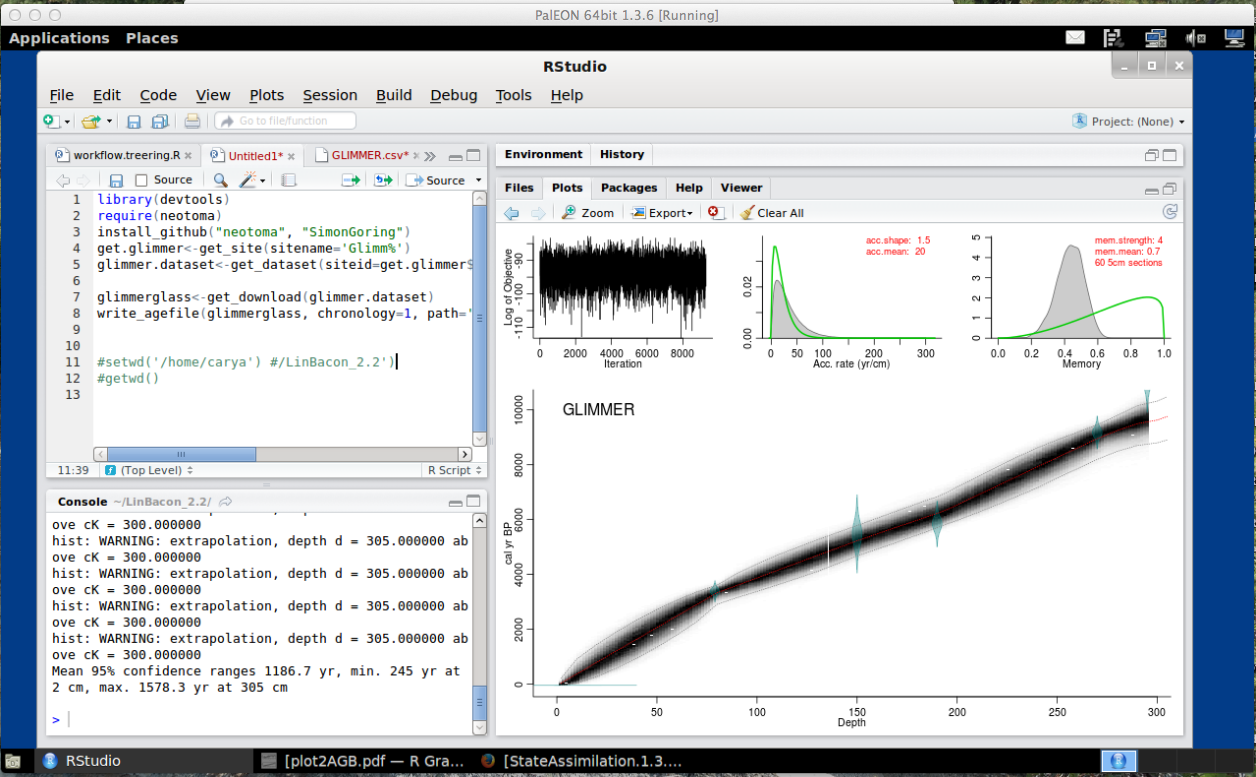
Here is an example of the age model example the class walked through for sediment collected from Glimmerglass Lake. It is a nice example of a model that is well mixed, fits well, and goes through all radiocarbon dates.

Glimmerglass BACON

The afternoon was dedicated to student presentations on their independent projects. There were a wide range of independent project topics including:

  1. State space model for plant macrofossils
  2. Quantify variance between lake pollen loadings using observed pollen proportions
  3. 2000 years of inferred forest structure in the southern Sierra Nevada from a wet meadow
  4. Empirical succession model application to the fading record problem and uncertainty in forest density trajectories
  5. Using pollen and squirrel fossils to explore two datasets with irregular spacing of time
  6. Exploring Colombian vegetation using 4 proxies: 13C, volcanic minerals, archaeological artifacts and charcoal
  7. Fire signals in southern CA
  8. Pollen in Australian lakes
  9. MCMC of Alaska Picea glauca (white spruce)
  10. Detecting dust storms in lake sediment cores – are the dust storms increasing?
  11. Using eddy flux data and terrestrial models to estimate NPP and biomass from tree rings

For only having 6 hours work, the projects turned out really well, with lots of converged iterations. It was great to see how much the students were able to pick up over the past 6 days.

We wrapped up big week with lots of hard work by celebrating with a classic Friday night fish fry dinner at Bent’s Camp!

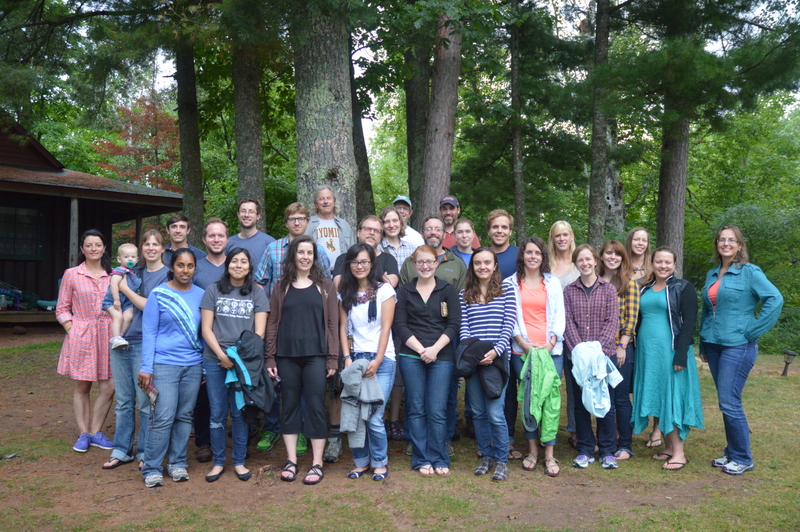
The group!


Camp PEON Days 4 & 5: DATA ASSIMILATION!

These two days involved focusing on learning about and applying data assimilation in the lab.

Image source: http://afamily.vn/tam-su-ban-doc/toi-tim-duoc-chong-hai-qua-mang-3402.chn

Image source: http://bit.ly/VI9YI7

Students learned about PDA – parameter data-assimilation NOT public displays of affection (although successful parameters data-assimilation could make you want to celebrate with public displays of affection for your computer).

During these two days students learned:

  1. The need to test-run your model.  If you know the model is wrong – tuning the parameters is not going to help.
  2. Adjusting your priors after your model run is a cardinal sin.  The solution is not to move your prior, but rather to go back and work on your model!
  3. An interesting problem in the iterative process of modeling is knowing when to stop.  When are your models good enough?  How much uncertainty is acceptable? This is especially important when thinking about the interface between science and policy.  What level of uncertainty is needed in order to make policy? While the course didn’t provide the answers to these questions – it did give students food for thought.

The students were able to assimilate the tree ring data measured from their tree cores into the PEcAn ecosystem model they had learned about on Day 3.

The following are some of the results from the tree ring data assimilation.

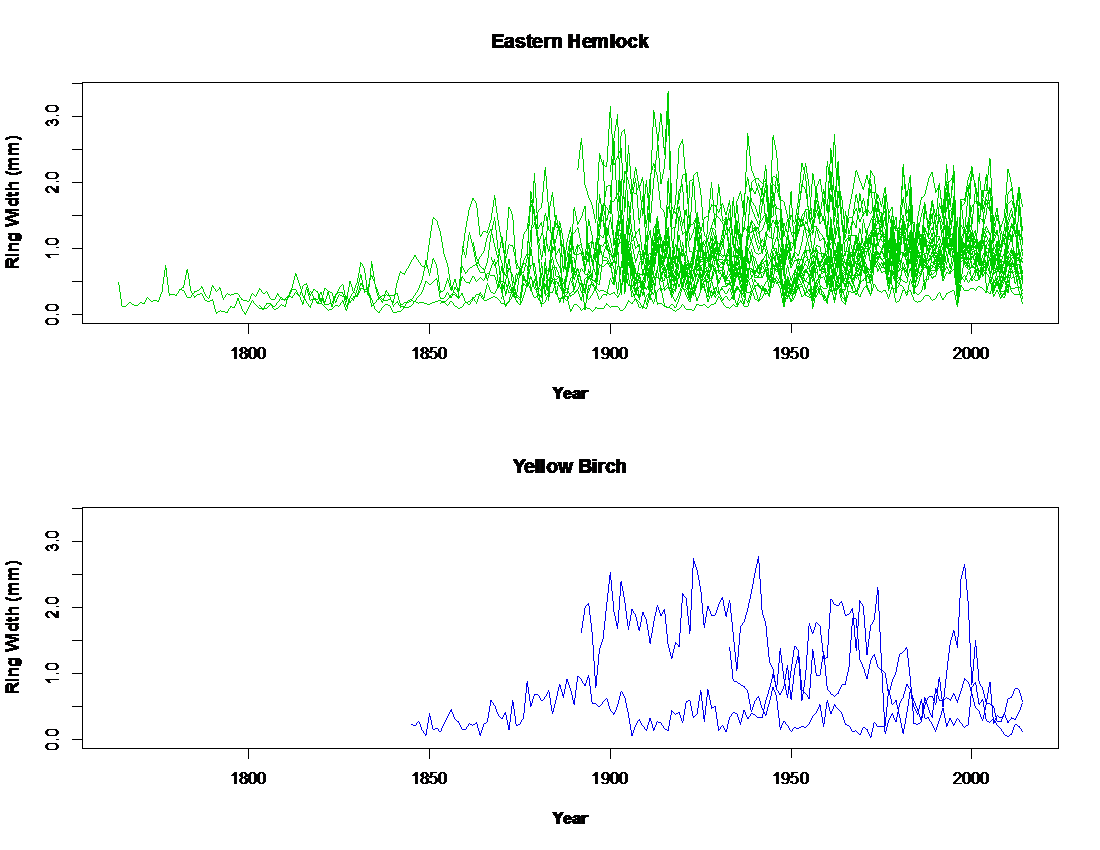
Figure 1. The ring widths from Eastern Hemlocks and Yellow Birches. Hemlocks went back to mid/early 1700s, birches to probably at least the early 1800s.

Figure 1. The ring widths from Eastern Hemlocks and Yellow Birches. Hemlocks went back to mid/early 1700s, birches to probably at least the early 1800s.

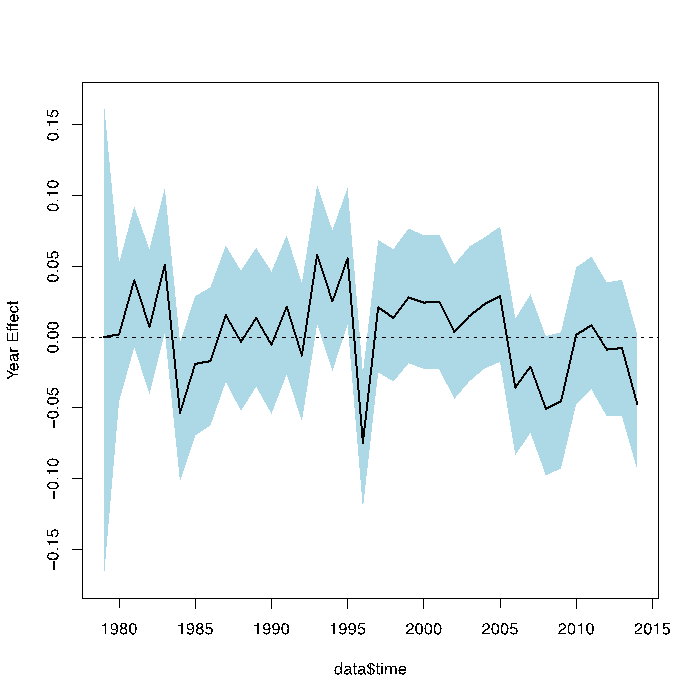
Figure 2. Tree Ring Year effects: For tree-ring folks, this is essentially your master chronology with uncertainty around it.

Figure 2. Tree Ring Year effects: For tree-ring folks, this is essentially your master chronology with uncertainty around it.

Figure 3. The above year effects can get combined with growth to look at annual aboveground biomass change (top) or cumulative aboveground biomass change (below).

Figure 3. The above year effects can get combined with growth to look at annual aboveground biomass change (top) or cumulative aboveground biomass change (below).

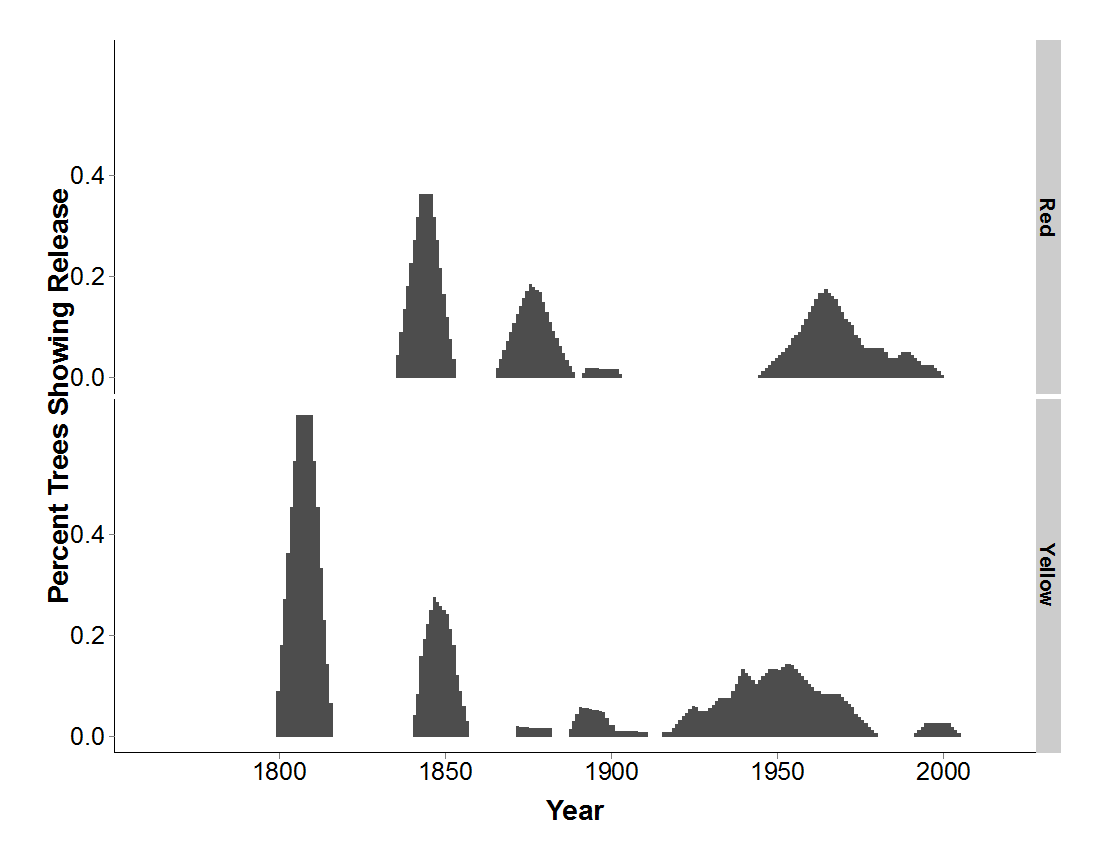
Figure 4. The tree rings can also be used to get a (rough) disturbance histories of the two plots (Red plot on top and Yellow plot on bottom).

Figure 4. The tree rings can also be used to get a (rough) disturbance histories of the two plots (Red plot on top and Yellow plot on bottom).

Camp Peon Day 3: BAYESIAN STATISTICS AND ECOSYSTEM MODELS

DSC_0922

Chris Paciorek, Research Statistician at the University of California, Berkeley

The lake sediment and tree cores have gotten us out to the field and demonstrated the types of methods used to collect paleodata. They have also provided us with new paleodata for the course. However, although going to the field to collect data is fun and important, it is the Bayesian statistics and ecosystem modeling that are the focus for camp. Without the statistical and ecosystem modeling tools, our analysis of the data would be very limited.

Our course is set up to introduce topics and then build on them throughout the week. For example, over Day 1 and 2 we have covered introductions to R, probability and Bayesian statistics, as well as dendrochronology, and ecosystem modeling. Day 3 was a big day for starting to put the pieces together with a statistical discussion in the morning by Chris Paciorek on running MCMC using JAGS and followed by an ecosystem model discussion by Mike Dietze about using PEcAn.

Mike Dietze, Professor of Ecosystem Modeling at Boston University

Mike Dietze, Professor of Ecosystem Modeling at Boston University

The following are a few nuggets that were covered on Day 3:
1. Bayes theorem, priors and posteriors.
2. Bayesian credible intervals vs. 95% confidence intervals – the Bayesian credible interval is what many ecologists typically think their 95% confident interval is!
3. Bayesian approaches are really nice for common issues in paleoecology – sampling that is not orthogonal, data that is not evenly spaced through time.
4. Acknowledging uncertainty and including it in statistical models is important.
5. When creating ecosystem modeling, it is important to quantify BOTH uncertainty in the data and the uncertainty in the models.
6. Think of models as scaffolds for data synthesis. Models are working theory on how things work. Models represent different spatial and temporal scales. Model acts like one giant covariance matrix.
7. Observations inform models but models can also inform what is measured in the field.

Lastly, it’s important to have fun and collaborate with your peers!

Day 2 of Camp PEON: TREE RINGS

Post by Jody Peters at the University of Notre Dame

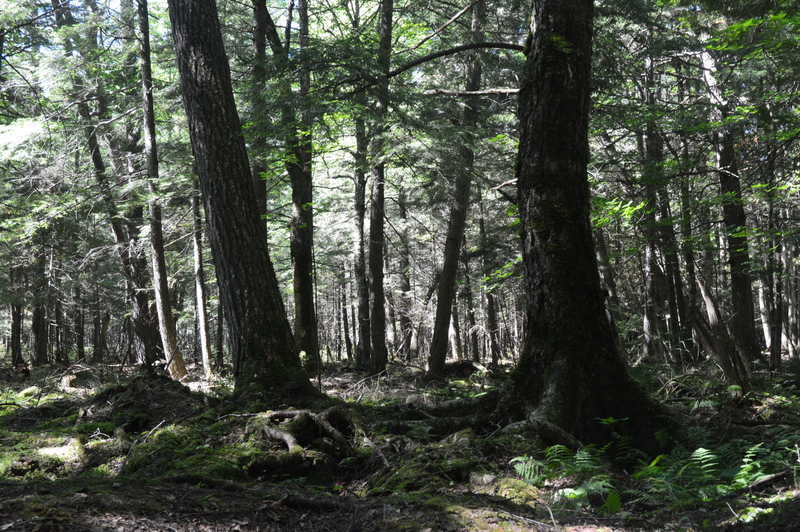
Hemlock on Guido Rahr Sr. Tenderfoot Nature Reserve

Hemlock on Guido Rahr Sr. Tenderfoot Nature Reserve

In addition to the lake sediment coring that took place on Day 1, there was also a lot of tree coring that happened. We set up 2, 0.5 ha plots in The Nature Conservancy’s Guido Rahr Sr. Tenderfoot Forest Reserve where we recorded dbh (diameter at breast height) of every tree, tagged those that were large enough and took cores from trees greater than 10 cm dbh. The two stands were mainly comprised of beautiful, large, old hemlocks, as well as some yellow birch, sugar maples, and northern white cedars.

Measuring dbh

Measuring dbh

Tree 1156

Tree 1156

DSC_1420

Coring a hemlock with dbh 71.8 cm

Extracting a core

Extracting a core

After the Day 1 coring, the job on Day 2 was to mount the cores and prepare them for drying.

DSC_1428 DSC_1433
DSC_1443 DSC_1482

On Day 3 we will move on to sanding and measuring the tree rings so that we can use them as part of a data assimilation exercise led by Michael Dietze to estimate Net Primary Production using the software package PEcAn on Day 5.

DSC_1424

Day 1 of Camp PEON: WORKING ON THE FROZEN FINGER!

Post by Simon Goring, Postdoc at the University of Wisconsin-Madison.
This post originally appeared at downwithtime.

We’re at Camp PalEON this week. It’s lots of fun and I think that the attendees get a lot out of it. Effectively we’re trying to distill process associated with the entire seven year project into one week of intensive learning. We teach probability theory, Bayesian methods, ecosystem modelling, dendrochronology, paleoecology and pollen analysis, age modelling and vegetation reconstruction to seventeen lucky early-career researchers in six intensive days (people were still plunking away at 11pm last night, our first day!).

We spend a lot of our time at the University of Notre Dame’s Environmental Research Center indoors looking at computers, but we had a very nice time yesterday afternoon. I hung out on a raft with Jack Williams and Jason McLachlan, coring with a frozen finger. The frozen finger is a special kind of corer, used to recover lake sediment that preserves the sediment stratigraphy in a much cleaner way than many other coring techniques.

Jack Williams and Jason McLachlan filling the core casing with ethanol so that the cold slurry conducts to the outer wall.

Jack Williams and Jason McLachlan filling the core casing with ethanol so that the cold slurry conducts to the outer wall. (photo credit: Jody Peters)

When using the frozen finger we fill the base of the corer with dry ice, and suspend the dry ice in ethanol to create an incredibly cold surface. We then drop the casing into the lake sediment. The sediment freezes to the surface of the core casing over the course of ten or fifteen minutes before we pull the corer back to the surface of the lake. The freeze-corer (or frozen finger) is often used for ancient DNA studies (e.g., Anderson-Carpenter et al., 2011) since the freezing process helps stabilize DNA in the lake sediment until the core can be brought back to the lab and analyzed.

The sediment on the outside of the core casing is peeled off carefully and wrapped before it is stored in a cooler of dry ice. (photo credit: Jody Peters)

The sediment on the outside of the core casing is peeled off carefully and wrapped before it is stored in a cooler of dry ice. (photo credit: Jody Peters)

Jason McLachlan and I are going to go sieve the sediment ourselves later this afternoon to give the workshop participants a chance to take a look at lake sediment, pick charcoal and find macrofossils later tonight. Meanwhile everyone is hard-coding an MCMC model in R and, later today, learning about Midwestern Paleoecology. All in all, it’s a great course and I’m happy to be involved with it for a second time. Hopefully we’ll have some more posts, but in the meantime we’ve made the preliminary readings open to the public on our project wiki, and most of our R work is up and available on GitHub so that you can take a look and work along.

Maine Fieldwork Part 2: The Bog

Post by Bob Booth, Associate Professor at Lehigh University; Steve Jackson, Center Director for the U.S. Department of the Interior’s Southwest Climate Science Center; Connor Nolan, Steve’s PhD Student at University of Arizona, and Melissa Berke, Assistant Professor at University of Notre Dame

Read about Maine Fieldwork Part 1.

Maine Fieldwork Part 2
Our adventures in bog coring, lobster consumption, dehydration, lake scouting, dipteran-slapping, and driving (lots of driving) began on July 6 when Bob Booth, Steve Jackson, Melissa Berke, and Connor Nolan rendezvoused in Portland, Maine, and drove to Bangor, our home base for coring at Caribou Bog. A testate-amoeba record of water-table depth from the bog will be compared to a lake-level record from Giles Pond (cored by Connor and Bryan Shuman back in November). These two sites are the new paleoclimate proxies for our Howland Forest HIPS (Highly Integrated Proxy Site). We also plan to use these records to better understand how lakes and peatlands respond to and record climate variation.

bog CaribouMap

Caribou Bog is a huge (~2200 hectares) ombrotrophic bog that has been the subject of many past investigations. We targeted a part of the bog that had been worked on in the 1980s by Feng Sheng Hu and Ron Davis. Coring took two full days (check out the video below to really appreciate the dipterans and the team’s jumping abilities). On the first day, we surveyed the bog with probbog - MBe rods to select a coring site. Then we hauled all of the heavy coring gear from the car, down a logging trail into the forest, through the “moat”, and then across the lumpy bog. Every part of the walk from the van to the bog and back was challenging, each for different reasons. The trail was hot and infested with deerflies and mosquitoes, the forest had no trail and low clearance and forced us to wrestle with young trees, the moat provided ample opportunity for losing boots and called for some gymnastic moves while carrying large and heavy stuff, and finally walking the 300 meters across the bog was like being on a demented stairmaster as we sunk a foot or two into the bog with every step.

bog flower - MB
After three trips to haul all of our gear, we cored the bog, collecting the upper peat (~3-4 meters) with a modified piston corer and the overlaps and deeper sections with a Russian corer. Although we thought we had ample drinking water the first day, we didn’t, and we chose not to drink the brown bog-water. Once we returned to the van, we headed straight to the nearest rural convenience store (only 3 miles away) and restored electrolytes and fluids.

We completed the coring on the second day, and dragged everything back to the van in three trips.  After dropping Bob off to meet his family in Portland, the rest of us enjoyed a seafood extravaganza at Fore Street restaurant in downtown Portland.  

portland head light

Portland Head Light

Lobster Feast

Lobster Feast

The cores went to Lehigh with Bob, but will eventually be analyzed by Connor. We will count testate amoebae and pollen in the core to get records of paleohydrology and paleovegetation spanning the past 2000 years.  Stay tuned!

Watch on YouTube: Caribou Bog 2014


Hu, F. S., & Davis, R. B. (1995). Postglacial development of a Maine bog and paleoenvironmental implications. Canadian Journal of Botany, 73(4), 638–649.


PalEON Sessions at AGU, December 15-19, 2014

FM14-logo-483px

We have a number of PalEONistas leading, co-leading, or giving invited talks for AGU sessions that revolve around topics central to PalEON.  If you are going to the American Geophysical Union conference in December and these sessions are of interest to you, be sure to submit your abstract by Wednesday, August 6!

Sessions

1. Finding Signal in the Noise: Dealing with Multiple Sources of Uncertainty in Paleoclimate and Paleoecology, Session ID: 3722 

The session is sponsored by Paleoceanography and Paleoclimatology and co-sponsored by Biogeosciences,  Global Environmental Change, and Nonlinear Geophysics.

Paleoclimatic and paleoecological proxies contain useful signals of past environmental state and variability that are confounded by multiple forms of uncertainty. Identifying meaningful signals and rigorously quantifying the multiple sources of uncertainty is essential to making inferences about past environments and applying these inferences to validate or improve earth system models or to inform decision-makers. Uncertainty can arise from multiple sources including inexact chronologies, unrepresented processes, uncertainties in the mechanisms that sense and archive past environmental change, and our capacity to describe these processes mathematically. In this session we will explore advances in disentangling this complexity via the use of mechanistic forward models, hierarchical statistical models, and other techniques to make robust inferences about past environments with well-quantified uncertainties.

PalEONistas involved: Jack Williams, Connor Nolan, Andria Dawson, John Tipton

2. Constraining Ecosystem Carbon Uptake and Long Term Storage Using Models and Data, Session ID: 2624

This session will focus on both short and long term processes with controlling ecosystem carbon uptake and storage using both modeling and observational approaches. Find more details HERE.

PalEONistas involved: Dave Moore, Valerie Trouet, Mike Dietze

3. Ecological Disturbance: Observing and Predicting Disturbance Impacts, Session ID: 2482

This session focuses on studies that address the effects of ecological disturbance on carbon, water, and nutrient dynamics, as well as methods for understanding non-equilibrium conditions. Find more details HERE.

PalEONistas involved: Jaclyn Hatala Matthes, Dave Moore, Mike Dietze

4. Phenology, Session ID: 3265

We encourage the submission of abstracts that address topics including phenological modeling, scaling from organisms to ecosystems, fusion of models and data, ecologicalforecasting, relationships between phenology and ecosystem processes and services, and the role of phenology in policy decision-making. Find more details HERE.

PalEONistas involved: Dave Moore

5. Inter-site Syntheses to Explore the Biophysical Controls on Ecosystem Mass and Energy Cycling, Session ID: 3725

The session is sponsored by Biogeosciences and co-sponsored by Global Environmental Change and Hydrology.

Data syntheses across a small number of geographically- or ecologically-similar research sites, or ‘micro-network’, can be very useful for exploring the response of ecosystem mass and energy cycling to a constrained set of biophysical driving variables. Thus, micro-network syntheses represent an important bridge between studies focused on hypothesis testing and model development at the site level, and the upscaling of those results to regional and continental landscapes characterized by wide gradients in climate and land cover regimes.  In this session, we welcome studies focused on cross-site data syntheses from a small number (2-7) of field sites to better understand how ecosystem carbon, water, or energy fluxes respond to meteorological drivers, edaphic conditions, and/or land cover change.  We invite contributions that draw from a range of leaf-level, tree-level, plot-level, and/or ecosystem-scale eco-physicological data.

PalEONistas involved: Neil Pederson (with many PalEONista co-authors)


You Are Suffering For the Greater Good of Science

Post by Simon Goring, Postdoc at the University of Wisconsin-Madison.
This post originally appeared on downwithtime.

When you have hayfever you are suffering for the greater good of science.”
-Me. The Larry Meiller Show, WPR. July 16, 2014 [Program Archive]

Figure 1. Your pain is science's gain. Pollen may go into your nose, but it also enters aquatic environments where it is preserved in lake sediments. Photo Credit: flickr/missrogue

Figure 1. Your pain is science’s gain. Pollen may go into your nose, but it also enters aquatic environments where it is preserved in lake sediments. Photo Credit: flickr/missrogue

Of course, I was talking paleoecology and the way we use airborne pollen trapped in lake sediments to help improve models of future climate change. We improve models by reconstructing forests of the past. This is one of the central concepts in PalEON (not suffering, paleoecology): Improve ecosystem model predictions for the future by testing them on independent reconstructions of the past. Give greater weight to models that perform well, and improve models that perform poorly.

I was lucky to be on the Larry Meiller Show along with Paul Hanson to discuss PalEON and GLEON, two large scale ecological projects with strong links to The University of Wisconsin. We talked a bit about climate change, large scale research, science funding, open science and historical Wisconsin. It was lots of fun and you can check out the archive here.

I feel like I was a little more prepared for this interview than I have been in the past. Jack Williams passed along his (autographed) copy of Escape from the Ivory Tower by Nancy Baron. The book helped me map out my “message box” and gave me a much better sense of what people might want to hear, as opposed to the things I wanted to talk about (how much can I talk about uncertainty, age modelling and temporal connectivity?). It was useful, and I hope I came off as well prepared and excited by my research (because I am). Regardless, just like learning R, public outreach is a skill, and one that I am happy to practice, if only because I intend to keep doing it.

Anyway, enough science outreach for one week. With this blog post and WPR I’m well above quota!

Sneak Peek at Results for Tree Composition Pre-Euro-American Settlement (ca. 1700-1850 AD)

Posted by Jody Peters with input from Simon Goring and Chris Paciorek

Just as many trees make up a mighty forest, many participants are needed to pull together and analyze data for PalEON.  Together we gain a deeper understanding of past forest dynamics, and use this knowledge to improve long-term forecasting capabilities.  Major components needed to understand past forest dynamics are tree composition, density and biomass prior to Euro-American settlement. In true macrosystems ecology fashion, over the past 3 years (and in some cases longer) individuals from multiple institutions (see Table and Figure captions, and Figure 3 here) have been working on collecting the data and developing a statistical multinomial model for tree composition in the Northeast and Midwest United States.  Our first task has been to estimate percent composition for several of the dominant forest taxa, and to provide reliable estimates of uncertainty.

We are excited to announce we have finally collected enough data to run the model across the entire northeastern United States!  Figure 1 provides an example of the composition results and associated uncertainty for beech and pine.  In addition to these two genera we have similar results for taxa such as oak, birch, hickory, maple, spruce, etc.  We can use these results to compare the pre-European Settlement forest composition to modern forests from US Forest Service Forest Inventory Assessment data as well as those extending 2000 years into the past using pollen data and STEPPS2 analyses (see this University of Wisconsin Press Release).  As we move forward with this project we will continue to update our datasets that have dispersed sampling (e.g., Indiana, Illinois and Ohio: Table 1) and we are in the process of developing maps of estimated density and biomass by tree taxon.

Stay tuned as more results come in and as the manuscripts get published!


Figure 1. Estimated composition (top maps) and associated uncertainty (bottom maps) created March 2014. Estimates come from a spatial multinomial model on an 8 km Albers grid, developed by Andy Thurman from the University of Iowa and Chris Paciorek from the University of California, Berkeley. The MCMC was run for 150,000 iterations, with the first 25,000 discarded as burn-in, and the remaining iterations subsampled (to save on storage and computation) to give 500 posterior draws.

Figure 1. Estimated composition (top maps) and associated uncertainty (bottom maps) created March 2014. Estimates come from a spatial multinomial model on an 8 km Albers grid, developed by Andy Thurman from the University of Iowa and Chris Paciorek and Andria Dawson from the University of California, Berkeley. The MCMC was run for 150,000 iterations, with the first 25,000 discarded as burn-in, and the remaining iterations subsampled (to save on storage and computation) to give 500 posterior draws.
Click on the image for a bigger, clearer picture.


Table 1. Source of tree data from Public Land Surveys from locations in the Northeast and Midwest United States. The “Sampling” column indicates when data came from the entire location (complete) or from a dispersed sample of townships or towns within the location.

LocationSamplingSource
MinnesotaCompleteDavid Mladenoff(University of Wisconsin - Madison)
WisconsinCompleteDavid Mladenoff(University of Wisconsin - Madison)
Michigan's Upper Peninsula & northern Lower PeninsulaCompleteMichigan Department of Natural Resources; David Mladenoff
Michigan's southern Lower PeninsulaDispersedJack Williams & Simon Goring
(University of Wisconsin - Madison)
IllinoisDispersedJason McLachlan (University of Notre Dame)
Illinois Chicago areaCompleteMarlin Bowles & Jenny McBride (The Morton Arboretum)
Illinois St. Louis areaCompleteDick Brugam (Southern Illinois University) & Paul Kilburn (Jefferson County Nature Association)
IndianaDispersedJason McLachlan (University of Notre Dame)
OhioDispersedCharles Cogbill
New England, New Jersey, New York and PennsylvaniaDispersedCharles Cogbill

PalEON on TV

Posted by Jody Peters, PalEON Program Manager

The elevator pitch (a 30 second to 2 min synopsis of your research) is critical for sharing science with other scientists and the general public. However, developing this pitch usually does not come naturally to most people. It is something that needs to be practiced. Recently Jason McLachlan and Sam Pecararo from the University of Notre Dame, had the opportunity to practice their pitches in featured segments on Outdoor Elements, a show on our local PBS station. Not only did Jason and Sam have to prepare their elevator pitch, but they also had to come up with visual props that would be interesting to view on TV.  We think they both did a great job condensing their science stories into a few minutes!

Jason’s segment, Paleobotany & Climate Change, originally aired on Feb 9, 2014 and focused on PalEON in general and specifically described some of our work with tree data from the Public Land Survey. After he was taped for this segment last fall, Jason wrote a blog post about what he wished he would have said. Compare what he wished he would have said to what actually was aired!

JasonOutdoorElements

Sam’s segment, Tree Coring, originally aired on February 16, 2014 and featured Sam coring a tree and talking about using tree rings to get an idea of how climate or other environmental variables influence tree growth.

SamOutdoorElements

Check out these segments to see Jason and Sam’s elevator pitch for some of the work of PalEON! Click on the links or photos above and scroll down to where it says “Play segment” to view. Each segment is approximately 7 minutes long.