
Post by Simon Goring, Postdoc at the University of Wisconsin-Madison.
This post originally appeared at downwithtime.
Dynamic Ecology had a post recently asking why there wasn’t an Ecology Blogosphere. One of the answers was simply that as ecologists we often recognize the depth of knowledge of our peers and as such, are unlikely (or are unwilling) to comment in an area that we have little expertise. This is an important point. I often feel like the longer I stay in academia the more I am surprised when I can explain a concept outside my (fairly broad) subject area clearly and concisely. It surprises me that I have depth of knowledge in a subject that I don’t directly study.
Of course, it makes sense. We are constantly exposed to ideas outside our disciplines in seminars, papers, on blogs & twitter, and in general discussions, but at the same time we are also exposed to people with years of intense disciplinary knowledge, who understand the subtleties and implications of their arguments. This is exciting and frightening. The more we know about a subject, the more we know what we don’t know. Plus, we’re trained to listen to other people. We ‘grew up’ academically under the guidance of others, who often had to correct us, so when we get corrected out of our disciplines we are often likely to defer, rather than fight.
This speaks to a broader issue though, and one that is addressed in the latest issue of Frontiers in Ecology and the Environment. The challenges of global change require us to come out of our disciplinary shells and to address challenges with a new approach, defined here as Macrosystems Ecology. At large spatial and temporal scales – the kinds of scales at which we experience life – ecosystems cease being disciplinary. Jim Heffernan and Pat Soranno, in the lead paper (Heffernan et al., 2014) detail three ecological systems that can’t be understood without cross-scale synthesis using multi-disciplinary teams.
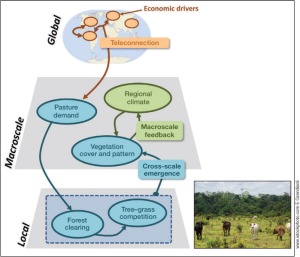
Figure 1. From Heffernan et al. (2014), multiple scales and disciplines interact to explain patterns of change in the Amazon basin.
The Amazonian rain forest is a perfect example of a region that is imperiled by global change, and can benefit from a Macrosystems approach. Climate change and anthropogenic land use drives vegetation change, but vegetation change also drives climate (and, ultimately, land use decisions). This is further compounded by teleconnections related to societal demand for agricultural products around the world and the regional political climate. To understand and address ecological problems in this region then, we need to understand cross-scale phenomena in ecology, climatology, physical geography, human geography, economics and political science.
Macrosystems proposes a cross-scale effort, linking disciplines through common questions to examine how systems operate at regional to continental scales, and at multiple temporal scales. These problems are necessarily complex, but by bringing together researchers in multiple disciplines we can begin to develop a more complete understanding of broad-scale ecological systems.
Interdisciplinary research is not something that many of us have trained for as ecologists (or biogeographers, or paleoecologists, or physical geographers. . . but that’s another post). It is a complex, inter-personal interaction that requires understanding of the cultural norms within other disciplines. Cheruvelil et al. (2014) do a great job of describing how to achieve and maintain high-functioning teams in large interdisciplinary projects, and Kendra also discusses this further in a post on her own academic blog.
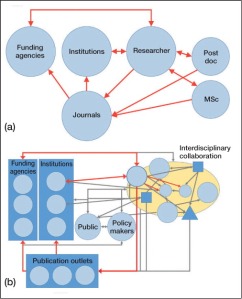
Figure 2. From Goring et al., (2014). Interdisciplinary research requires effort in a number of different areas, and these efforts are not recognized under traditional reward structures.
In Goring et al. (2014) we discuss a peculiar issue that is posed by interdisciplinary research. The reward system in academia is largely structured to favor disciplinary research. We refer to this in our paper as a disciplinary silo. You are in a department of X, you publish in the Journal of X, you go to the International Congress of X and you submit grant requests to the X Program of your funding agency. All of these pathways are rewarded, and even though we often claim that teaching and broader outreach are important, they are important inasmuch as you need to not screw them up completely (a generalization, but one I’ve heard often enough).
As we move towards greater interdisciplinarity we begin to recognize that simply superimposing the traditional rewards structure onto interdisciplinary projects (Figure 2) leaves a lot to be desired. This is particularly critical for early-career researchers. We are asking these researchers (people like me) to collaborate broadly with researchers around the globe, to tackle complex issues in global change ecology, but, when it comes time to assess their research productivity we don’t account for the added burden that interdisciplinary research can require of a researcher.
Now, I admit, this is self-serving. As an early career researcher, and member of a large interdisciplinary team (PalEON), much of what we propose in Goring et al. (2014) strongly reflects on my own personal experience. Outreach activities, the complexities of dealing with multiple data sources, large multi-authored papers, posters and talks, and the coordination of researchers across disciplines are all realities for me, and for others in the project, but ultimately, we get evaluated on grants and papers. The interdisciplinary model of research requires effort that never gets valuated by hiring or tenure committees.
That’s not to say that hiring committees don’t consider this complexity, and I know they’re not just looking for Nature and Science papers, but at the same time, there is a new landscape for researchers out there, and we’re trying to evaluate them with an old map.
In Goring et al. (2014) we propose a broader set of metrics against which to evaluate members of large interdisciplinary teams (or small teams, there’s no reason to be picky). This list of new metrics (here) includes traditional metrics (numbers of papers, size of grants), but expands the value of co-authorship, recognizing that only one person is first in the authorship list, even if people make critical contributions; provides support for non-disciplinary outputs, like policy reports, dataset generation, non-disciplinary research products (white papers, books) and the creation of tools and teaching materials; and adds value to qualitative contributions, such as facilitation roles, helping people communicate or interact across disciplinary divides.
This was an exciting set of papers to be involved with, all arising from two meetings associated with the NSF Macrosystems Biology program (part of NSF BIO’s Emerging Frontiers program). I was lucky enough to attend both meetings, the first in Boulder CO, the second in Washington DC. As a post-doctoral researcher these are the kinds of meetings that are formative for early-career researchers, and clearly, I got a lot out of it. The Macrosystems Biology program is funding some very exciting programs, and this Frontiers issue attempts to get to the heart of the Macrosystems approach. It is the result of many hours and days of discussion, and many of the projects are already coming to fruition. It is an exciting time to be an early-career researcher, hopefully you agree!


