Self thin you must

yoda

Post by Dave Moore, Professor at The University of Arizona
This post also appeared on the Paleonproject Tumblr

We spent a lot of time last week in Tucson discussing sampling protocols for PalEON’s tree ring effort that will happen this summer. The trouble is that trees (like other plants) will self thin over time and when we collect tree cores to recreate aboveground biomass increment we have to be careful about how far back in time we push our claims. Bonus points if you can explain the photo in ecological terms! I stole it from Rachel Gallery’s Ecology class notes.

Neil Pederson and Amy Hessl will be taking the lead in the North East while Ross Alexander working with Dave Moore and Val Trouet (LTRR) will push our sampling into the Midwest and beyond the PalEON project domain westwards. This is a neat collaboration between the PalEON project and another project funded by the DOE. Francesc Montane and Yao Liu who recently joined my lab will be helping to integrate these data into the Community Land Model. Also Mike Dietze‘s group will be using the ED model to interpret the results.

Because we want to integrate these data into land surface models we need to have a robust statistical framework so we had some equally robust discussions about statistical considerations with Chris Paciorek and Jason McLachlan and other members of the PalEON team.

Forests in a Changing Climate

Post by Andria Dawson, University of Notre Dame/University of California, Berkeley Postdoc

fall_forest3

Forests play an important role in the global carbon cycle by storing and releasing carbon through processes such as establishment, growth, mortality, and disturbance. Forests can be carbon sources if they release more carbon than they absorb, or carbon sinks if they absorb more than they release. Knowing that forests affect the carbon budget, it is natural to ask about the interactions between forests and the changing climate. Do forests mitigate climate change? The answer to this question is seemingly complex. Here are a few of the many reasons why…

Albedo

Some of the solar radiation that reaches the Earth is absorbed, while some is reflected. The reflectivity of a surface, or albedo, is some measure of the whiteness of a surface. Snow has a high albedo, while open ocean has a low albedo. Forests typically have a low albedo. To keep the earth cool, all we need to do is absorb less of this incoming radiation. Researchers at Dartmouth college found that in regions where snow is common and forest productivity is low, it is beneficial to the economy and the climate to clear those forests, which modulates the temperature by increasing albedo [1].

Carbon dioxide

Trees use carbon dioxide to photosynthesize. As atmospheric CO2 increases, trees are expected to experience increased growth, at least up to a point. CO2 is absorbed through the stomata, but while these stomata are open and readily absorbing CO2, they are also allowing the tree to lose moisture. When CO2 is more readily available, trees don’t have to open their stomata as wide to absord it. This leads to less moisture loss through the stomata, leaving the tree with additional resources for other processes, such as growth [2]. And in turn, increased growth leads to increased CO2 consumption. But only up to a point.

Terpenes

Forests interact with the atmosphere by releasing biological aerosols as well as compounds known as terpenes. Terpenes react and form aerosols, forming clouds, which in part determines how much light is reflected back to space. Spracklen et al. found that terpenes from a simulated pine forest increased cloud thickness, causing an additional 5% of solar radiation to be reflected back to space [3].

Changes in natural disturbance regimes

Climate change has the potential to affect disturbance regimes. Dale et al. succinctly wrote that “climate change can affect forests by altering the frequency, intensity, duration, and timing of fire, drought, introduced species, insect and pathogen outbreaks, hurricanes, windstorms, ice storms, or landslides” [4]. These disturbance events affect forests in different ways, from causing widespread mortality to causing changes in structure, composition, and function.

How to make sense of all of this?

The take home message is that an important relationship exists between forests and climate. The cumulative effect of these feedback mechanisms are difficult to disentangle, and further collaborative research based on ecosystem and atmospheric models confronted with data are key as we move forward. PalEON is one such collaborative effort, drawing from talents to work towards a better understanding of forest systems.

References
[1] Updated citation as of 4-17-14:Lutz, David A., Howarth, Richard B., “Valuing albedo as an ecosystem service: implications for forest management. Climatic Change (2014): doi:10.1007/s10584-014-1109-0
Original citation: Dartmouth College. “Can cutting trees help fight global warming? More logging, deforestation may better serve climate in some areas, study finds.” ScienceDaily. ScienceDaily, 5 December 2013.

[2] Keenan, Trevor F., et al. “Increase in forest water-use efficiency as atmospheric carbon dioxide concentrations rise.” Nature 499.7458 (2013): 324-327.

[3] Spracklen, Dominick V., Boris Bonn, and Kenneth S. Carslaw. “Boreal forests, aerosols and the impacts on clouds and climate.” Philosophical Transactions of the Royal Society A: Mathematical, Physical and Engineering Sciences 366.1885 (2008): 4613-4626.

[4] Dale, Virginia H., et al. “Climate Change and Forest Disturbances Climate change can affect forests by altering the frequency, intensity, duration, and timing of fire, drought, introduced species, insect and pathogen outbreaks, hurricanes, windstorms, ice storms, or landslides.” BioScience 51.9 (2001): 723-734.

Macrosystems Ecology: The More We Know The Less We Know.

Post by Simon Goring, Postdoc at the University of Wisconsin-Madison.
This post originally appeared at downwithtime.

Dynamic Ecology had a post recently asking why there wasn’t an Ecology Blogosphere. One of the answers was simply that as ecologists we often recognize the depth of knowledge of our peers and as such, are unlikely (or are unwilling) to comment in an area that we have little expertise. This is an important point. I often feel like the longer I stay in academia the more I am surprised when I can explain a concept outside my (fairly broad) subject area clearly and concisely. It surprises me that I have depth of knowledge in a subject that I don’t directly study.

Of course, it makes sense. We are constantly exposed to ideas outside our disciplines in seminars, papers, on blogs & twitter, and in general discussions, but at the same time we are also exposed to people with years of intense disciplinary knowledge, who understand the subtleties and implications of their arguments.  This is exciting and frightening.  The more we know about a subject, the more we know what we don’t know. Plus, we’re trained to listen to other people.  We ‘grew up’ academically under the guidance of others, who often had to correct us, so when we get corrected out of our disciplines we are often likely to defer, rather than fight.

This speaks to a broader issue though, and one that is addressed in the latest issue of Frontiers in Ecology and the Environment.  The challenges of global change require us to come out of our disciplinary shells and to address challenges with a new approach, defined here as Macrosystems Ecology.  At large spatial and temporal scales – the kinds of scales at which we experience life – ecosystems cease being disciplinary.  Jim Heffernan and Pat Soranno, in the lead paper (Heffernan et al., 2014) detail three ecological systems that can’t be understood without cross-scale synthesis using multi-disciplinary teams.
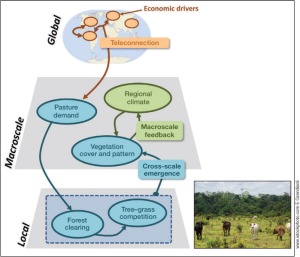
Figure 1. From Heffernan et al. (2014), multiple scales and disciplines interact to explain patterns of change in the Amazon basin.

Figure 1. From Heffernan et al. (2014), multiple scales and disciplines interact to explain patterns of change in the Amazon basin.

The Amazonian rain forest is a perfect example of a region that is imperiled by global change, and can benefit from a Macrosystems approach.  Climate change and anthropogenic land use drives vegetation change, but vegetation change also drives climate (and, ultimately, land use decisions). This is further compounded by teleconnections related to societal demand for agricultural products around the world and the regional political climate. To understand and address ecological problems in this region then, we need to understand cross-scale phenomena in ecology, climatology, physical geography, human geography, economics and political science.

Macrosystems proposes a cross-scale effort, linking disciplines through common questions to examine how systems operate at regional to continental scales, and at multiple temporal scales.  These problems are necessarily complex, but by bringing together researchers in multiple disciplines we can begin to develop a more complete understanding of broad-scale ecological systems.

Interdisciplinary research is not something that many of us have trained for as ecologists (or biogeographers, or paleoecologists, or physical geographers. . . but that’s another post).  It is a complex, inter-personal interaction that requires understanding of the cultural norms within other disciplines.  Cheruvelil et al. (2014) do a great job of describing how to achieve and maintain high-functioning teams in large interdisciplinary projects, and Kendra also discusses this further in a post on her own academic blog.
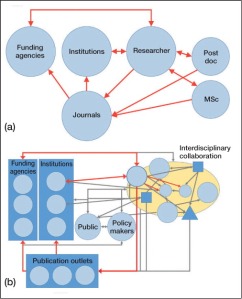
Figure 2. Interdisciplinary research requires effort in a number of different areas, and these efforts are not recognized under traditional reward structures.

Figure 2. From Goring et al., (2014). Interdisciplinary research requires effort in a number of different areas, and these efforts are not recognized under traditional reward structures.

In Goring et al. (2014) we discuss a peculiar issue that is posed by interdisciplinary research.  The reward system in academia is largely structured to favor disciplinary research.  We refer to this in our paper as a disciplinary silo.  You are in a department of X, you publish in the Journal of X, you go to the International Congress of X and you submit grant requests to the X Program of your funding agency.  All of these pathways are rewarded, and even though we often claim that teaching and broader outreach are important, they are important inasmuch as you need to not screw them up completely (a generalization, but one I’ve heard often enough).

As we move towards greater interdisciplinarity we begin to recognize that simply superimposing the traditional rewards structure onto interdisciplinary projects (Figure 2) leaves a lot to be desired.  This is particularly critical for early-career researchers.  We are asking these researchers (people like me) to collaborate broadly with researchers around the globe, to tackle complex issues in global change ecology, but, when it comes time to assess their research productivity we don’t account for the added burden that interdisciplinary research can require of a researcher.

Now, I admit, this is self-serving.  As an early career researcher, and member of a large interdisciplinary team (PalEON), much of what we propose in Goring et al. (2014) strongly reflects on my own personal experience.  Outreach activities, the complexities of dealing with multiple data sources, large multi-authored papers, posters and talks, and the coordination of researchers across disciplines are all realities for me, and for others in the project, but ultimately, we get evaluated on grants and papers.  The interdisciplinary model of research requires effort that never gets valuated by hiring or tenure committees.

That’s not to say that hiring committees don’t consider this complexity, and I know they’re not just looking for Nature and Science papers, but at the same time, there is a new landscape for researchers out there, and we’re trying to evaluate them with an old map.

In Goring et al. (2014) we propose a broader set of metrics against which to evaluate members of large interdisciplinary teams (or small teams, there’s no reason to be picky).  This list of new metrics (here) includes traditional metrics (numbers of papers, size of grants), but expands the value of co-authorship, recognizing that only one person is first in the authorship list, even if people make critical contributions; provides support for non-disciplinary outputs, like policy reports, dataset generation, non-disciplinary research products (white papers, books) and the creation of tools and teaching materials; and adds value to qualitative contributions, such as facilitation roles, helping people communicate or interact across disciplinary divides.

This was an exciting set of papers to be involved with, all arising from two meetings associated with the NSF Macrosystems Biology program (part of NSF BIO’s Emerging Frontiers program).  I was lucky enough to attend both meetings, the first in Boulder CO, the second in Washington DC.  As a post-doctoral researcher these are the kinds of meetings that are formative for early-career researchers, and clearly, I got a lot out of it.  The Macrosystems Biology program is funding some very exciting programs, and this Frontiers issue attempts to get to the heart of the Macrosystems approach. It is the result of many hours and days of discussion, and many of the projects are already coming to fruition.  It is an exciting time to be an early-career researcher, hopefully you agree!

PEONs at AGU

If you are going to AGU be sure to look around for PalEONs In addition to a number of PEONs that are attending AGU, we will have 3 PalEON posters and 1 talk that will be given. Here are the details. Check it out!

Posters – Monday morning
1) Goring et al. Effects of Euro-American settlement and historic climate variability on species-climate relationships and the co-occurrence of dominant tree species. AGU 2013. (Poster, B11G-0438)

2) Matthes et al. Representations of historic vegetation dynamics in CMIP5 and MsTMIP models (Poster B11E-0401)

3) Dawson et al. Spatio-temporal changes in forest composition inferred from fossil pollen records in the Upper Midwestern USA (Poster, B11G-0446)

Talk – Thursday morning
1) Steinkamp and Hickler. Is drought-induced forest dieback globally increasing? (Talk, B42B. Ecological Disturbance: Observing and Predicting the Impacts of Landscape Disturbance III)

The Invasion of the Zombie Maples

Post by Ana Camila Gonzalez, Undergraduate Researcher with Neil Pederson and the Tree Ring Laboratory at Columbia’s Lamont-Doherty Earth Observatory

As an undergraduate student interning at the Tree Ring Lab at Lamont-Doherty Earth Observatory, my involvement with PalEON has been rather localized to the data production side of things. My knowledge on the dynamics of climate and the models involved in forecasting future climate change is obviously limited as a second-year student. My knowledge on how frustrating it can be to cross-date the rings in Maple trees, however, is more extensive.

This past summer I was able to join the Tree Ring Lab on a fieldwork trip to Harvard Forest in Petersham, MA. My main task was to map each plot where we cored, recording the species of each tree cored, its distance to the plot center, its DBH, its canopy position, its compass orientation, and any defining characteristics (the tree was rotten, hollow, had two stems, etc.). The forest was beautiful, but it became more beautiful every time I wrote down the letters QURU (Quercus rubra)I had plenty of experience with oaks, and knew that they did not often create false or missing rings and are thus a fairly easy species to cross-date. I shuddered a little every time I had to write down BEAL (Betula alleghaniensis), however, since I had looked at a few yellow birches before and knew the rings were sometimes impossible to see let alone cross-date. I had no reaction to the letters ACRU (Acer rubrum), however, since I had never looked at a red maple core before. I was happy that it was a tree I could easily identify, and so I didn’t mind that the letters kept coming up. Had I known what was to come, I would’ve found a way to prevent anyone from putting a borer to a red maple.

At first, the maples seemed to be my friends. The rings were sensitive enough that multiple marker years helped me figure out where the missing rings where, what was false and what was real. I morbidly became a fan of the gypsy moth outbreak of 1981, because in many cases (but not all) it produced a distinct white ring that marked that year very clearly. This was definitely challenging, as the trees also seemed to be locally sensitive (a narrow ring in one tree might not at all be present in another) but all in all it seemed to be going well.

And then came the Zombie Maples.

Fig (a) Anatomy of a White Ring: Above is a core collected in 2003. It was alive. The white ring in the center of the image is 1981, the year of the regional gypsy moth outbreak in New York and New England.

That white ring you’re seeing above is the characteristic 1981 ring from a Zombie Maple cored in 2003. After that ring we can only see four rings – but this tree is alive, which means that there should be 13 rings after 1990 (Fig b). This means approximately 10 are missing.

Fig (b) Anatomy of a Zombie Maple: Above is a core collected in 2003. It was alive. The 1990 ring is marked in the image just right of center. There should be 13 rings between 1990 and the bark. You can only see four. Is it Alive? Is it Dead? Eek! It is a Zombie!!

This kind of suppression in the last two decades was present in multiple cores, and it made many perfectly alive trees seem like they should have been dead. Nine rings missing in a little over one millimeter. We see even more severe cases in our new collection: 15 rings where there should be 30 rings in about 2 millimeters – how is this tree supporting itself?

Cross-dating these cores took a lot longer than planned, and at times I was tempted to pretend my box of maples went missing, but afterwards I felt I was a much stronger cross-dater, and I’m realizing more and more that this really matters. If you’re going to base a model off of data that involves ring-width measurements from particular years, you better make sure you have the right years. What if we didn’t know the gypsy moth outbreak occurred in 1981, and somebody counting the rings back on the Zombie maple core above was led to believe it occurred in 1996? Our understanding of the trigger for this event would be incorrect because we would be looking for evidence from the wrong decade.

In a way, the Maples are still my friends. They were almost like the English teacher in high school who graded harshly who you didn’t appreciate until you realized how much better your writing had become.

PalEON Goes Into the Field

Post by Connor Nolan, University of Arizona Graduate Student

On Sunday November 3, Bryan Shuman and I (Connor Nolan) packed up a rental van with coring gear and hit the road for the 5.5 hour drive from Woods Hole, MA to Bangor, ME. 

Our aim was to do identify and core a lake for lake-level reconstruction near-ish to the Howland Experimental Forest flux site. We can survey lakes for evidence of past lake level changes using ground penetrating radar. The first day we had adventures in learning to navigate Maine’s back roads and we surveyed 2 lakes – Crystal Lake and Pickerel Pond. Both were beautiful sites, but the past lake level story was not very clear. 

Day 2 included surveys of 3 more lakes — Peep Lake, Salmon Pond, and Giles Pond — and an excursion through the largest industrial blueberry farm in North America (an interesting looking site called Rocky Lake is on their property, we did not survey it this trip due to big no trespassing signs on the property…). Just as we were starting to wonder if we would find the right lake on this trip we surveyed Giles Pond and it turned out to be the one! We arrived in the perfect light to take a great picture.Day 3 we cored Giles Pond along a transect. We ended up with 4 cores in all from this trip with lots of sand layers (a good thing for this kind of work!!). The Younger Dryas has a very distinctive lithology in this region, a light gray clay, and we have this lithology in some of our cores so we should have a record that goes back nearly 15,000 years! 

It was my first lake coring experience and it was a lot of fun! The cores are currently at Woods Hole Oceanographic Institute with Bryan. I will make a return trip there before long to do some initial analyses and then ship the cores back to Arizona for initial dating and more work!

The Prairie Peninsula

Post by Will Chronister, University of Notre Dame Undergraduate Researcher

My project within PalEON explores the Prairie Peninsula, an intriguing feature of the pre-settlement Midwest that consisted of a bulge of prairie into Illinois and Indiana where forest was prevalent in surrounding areas. Human settlement and agriculture essentially wiped out the Midwestern prairie and replaced it with farms, towns, and forests, but in 1935, Ohio State University ecologist Edgar Transeau depicted the region as it originally existed. Transeau based his map on information contained in Public Land Survey (PLS) notes, which provide information about the landscape and were recorded when the land was first being explored and sold. However, Transeau’s map, while useful visually, lacks any accompanying data to characterize the prairies and forests of the time, and therefore has questionable accuracy. Furthermore, the map interestingly contains no indication of a prairie-forest transitional region.

Edgar Transeau’s 1935 Prairie Peninsula Map

In order to learn more about the Prairie Peninsula and determine the accuracy of Transeau’s map, we are gathering Illinois and Indiana PLS data from the old survey notes in townships within and around the Peninsula. This is helpful for my personal project and also contributes to the overall PalEON effort of collecting data from all of pre-settlement Illinois and Indiana. When we have enough townships completed, we will create a map of the vegetation and compare it to Transeau’s map. In addition to testing Transeau’s map, we will also look into the causes of the Prairie Peninsula, which may include such factors as precipitation, soils, hydrology, and so forth.

Ultimately this research is important for a couple of reasons. Firstly, it will be beneficial to confirm Transeau’s map of the Prairie Peninsula and/or create a better one so that we have an accurate picture of the 19th century Midwest. Secondly, if we can pin down the causes of this irregular region of prairie, it will inform the study of modern-day environments where the same processes could be taking place. Given the potential effects of climate change, the need to understand what causes a prairie to thrive in place of a forest, as well as other biome patterns, has never been more pressing. Our hope is that our research of the Prairie Peninsula can be a small contribution to this much-needed knowledge.

Update: Down-scaled Meteorological Drivers

Jaclyn Hatala Matthes and Mike Dietze from Boston University have finished down-scaling the meteorological drivers for the PalEON model-intercomparison project over the PalEON spatial domain for the time period 850-2010AD. These meteorological drivers are being distributed to modeling groups for three initial test sites – Harvard Forest, Howland Forest, and UNDERC. Preliminary comparisons will take place at the upcoming PalEON Annual Meeting in December.

For the PalEON model inter-comparison, we down-scaled meteorological drivers from the Community Climate System Model (CCSM4) from monthly averages at ~1.25 degree spatial resolution to 6-hourly averages at 0.5 degree spatial resolution using an artificial neural network technique (Kumar et al 2012) with the CRUNCEP dataset.


Phil Higuera Talks About Fires in France

Phil Higuera recently attended a meeting of the Global Paleofire Working Group (GPWG) in Frasne, France, where he presented a summary of his lab’s work focused on understanding the causes and consequences of fire-regime change across multiple temporal scales (PDF). The goal of the GPWG is to provide the scientific community with a global charcoal dataset to facilitate research on fire in the Earth system. The meeting in France was focused on “test-driving” a toolkit being developed in the R statistical language to synthesize multiple records from the global charcoal database, and work towards the release of Version 4 of the database. This work was supported by the Past Global Changes program (PAGES) and NSF funding from the WildFIRE PIRE and PalEON projects.