


Topic Modeling Tool – Enumerating and visualizing latent themes
Posted on February 6, 2020 in Distant Reader by Eric Lease Morgan
Technically speaking, topic modeling is an unsupervised machine learning process used to extract latent themes from a text. Given a text and an integer, a topic modeler will count & tabulate the frequency of words and compare those frequencies with the distances between the words. The words form “clusters” when they are both frequent and near each other, and these clusters can sometimes represent themes, topics, or subjects. Topic modeling is often used to denote the “aboutness” of a text or compare themes between authors, dates, genres, demographics, other topics, or other metadata items.
Topic Modeling Tool is a GUI/desktop topic modeler based on the venerable MALLET suite of software. It can be used in a number of ways, and it is relatively easy to use it to: list five distinct themes from the Iliad and the Odyssey, compare those themes between books, and, assuming each chapter occurs chronologically, compare the themes over time.
Simple list of topics
Topics distributed across a corpus
Comparing the two books of Homer
Topics compared over time
Topic Modeling Tool Recipes
These few recipes are intended to get you up and running when it comes to Topic Modeling Tool. They are not intended to be a full-blown tutorial. This first recipe merely divides a corpus into the default number of topics and dimensions:
- Download and install Topic Modeling Tool
- Copy (not move) the whole of the txt directory to your computer’s desktop
- Create a folder/directory named “model” on your computer’s desktop
- Open Topic Modeling Tool
- Specify the “Input Dir…” to be the txt folder/directory on your desktop
- Specify the “Output Dir…” to be the folder/directory named “model” on your desktop
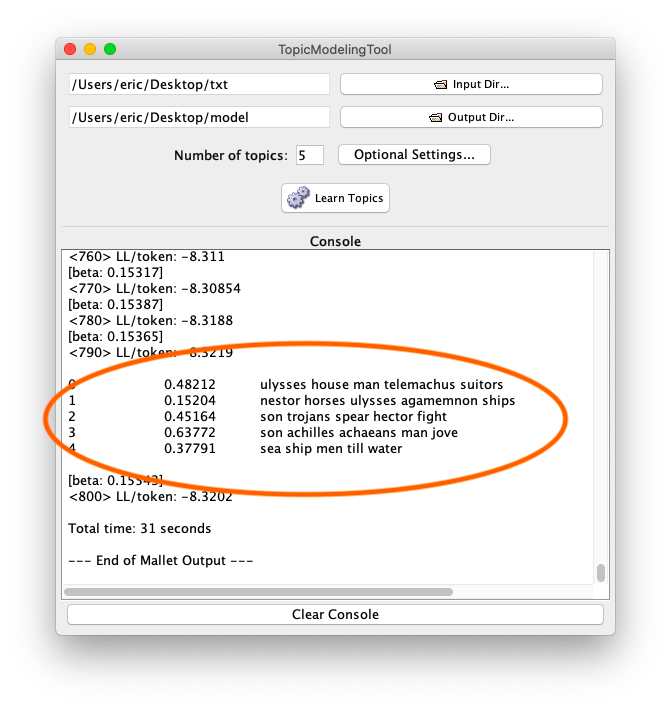
- Click “Learn Topics”; the result ought to be a a list of ten topics (numbered 0 to 9), and each topic is denoted with a set of scores and twenty words (“dimensions”), and while functional, such a result is often confusing
This recipe will make things less confusing:
- Change the number of topics from the default (10) to five (5)
- Click the “Optional Settings…” button
- Change the “The number of topic words to print” to something smaller, say five (5)
- Click the “Ok” button
- Click “Learn Topics”; the result will include fewer topics and fewer dimensions, and the result will probably be more meaningful, if not less confusing
There is no correct number of topics to extract with the process of topic modeling. “When considering the whole of Shakespeare’s writings, what is the number of topics it is about?” This being the case, repeat and re-repeat the previous recipe until you: 1) get tired, or 2) feel like the results are at least somewhat meaningful.
This recipe will help you make the results even cleaner by removing nonsense from the output:
- Copy the file named “stopwords.txt” from the etc directory to your desktop
- Click “Optional Settings…”; specify “Stopword File…” to be stopwords.txt; click “Ok”
- Click “Learn Topics”
- If the results contain nonsense words of any kind (or words that you just don’t care about), edit stopwords.txt to specify additional words to remove from the analysis
- Go to Step #3 until you get tired; the result ought to be topics with more meaningful words
Adding individual words to the stopword list can be tedious, and consequently, here is a power-user’s recipe to accomplish the same goal:
- Identify words or regular expressions to be excluded from analysis, and good examples include all numbers (\d+), all single-letter words (\b\w\b), or all two-letter words (\b\w\w\b)
- Use your text editor’s find/replace function to remove all occurrences of the identified words/patterns from the files in the txt folder/directory; remember, you were asked to copy (not move) the whole of the txt directory, so editing the files in the txt directory will not effect your study carrel
- Run the topic modeling process
- Go to Step #1 until you: 1) get tired, or 2) are satisfied with the results
Now that you have somewhat meaningful topics, you will probably want to visualize the results, and one way to do that is to illustrate how the topics are dispersed over the whole of the corpus. Luckily, the list of topics displayed in the Tool’s console is tab-delimited, making it easy to visualize. Here’s how:
- Topic model until you get a set of topics which you think is meaningful
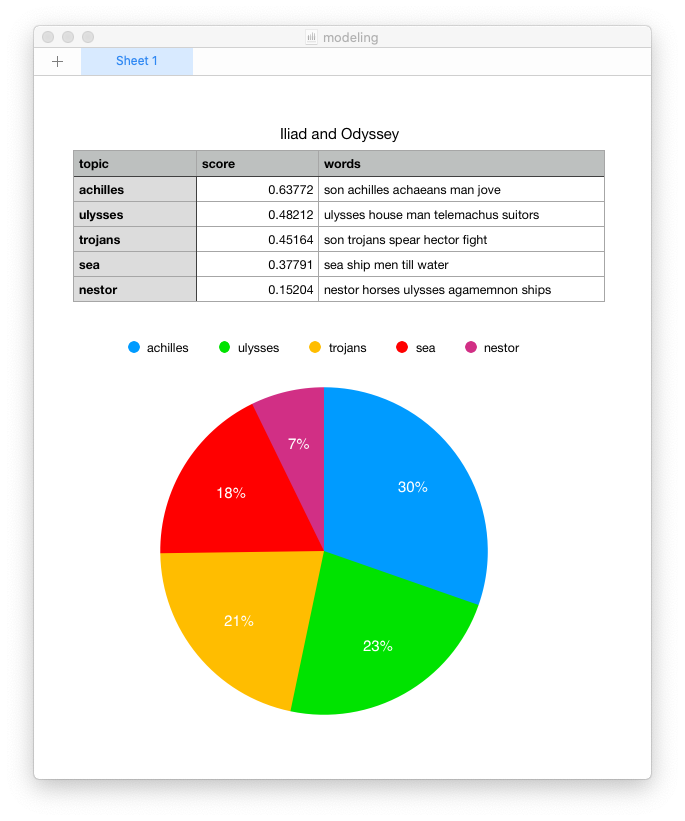
- Copy the resulting topics, and this will include the labels (numbers 0 through n), the scores, and the topic words
- Open your spreadsheet application, and paste the topics into a new sheet; the result ought to be three columns of information (labels, scores, and words)
- Sort the whole sheet by the second column (scores) in descending numeric order
- Optionally replace the generic labels (numbers 0 through n) with a single meaningful word, thus denoting a topic
- Create a pie chart based on the contents of the first two columns (labels and scores); the result will appear similar to an illustration above and it will give you an idea of how large each topic is in relation to the others
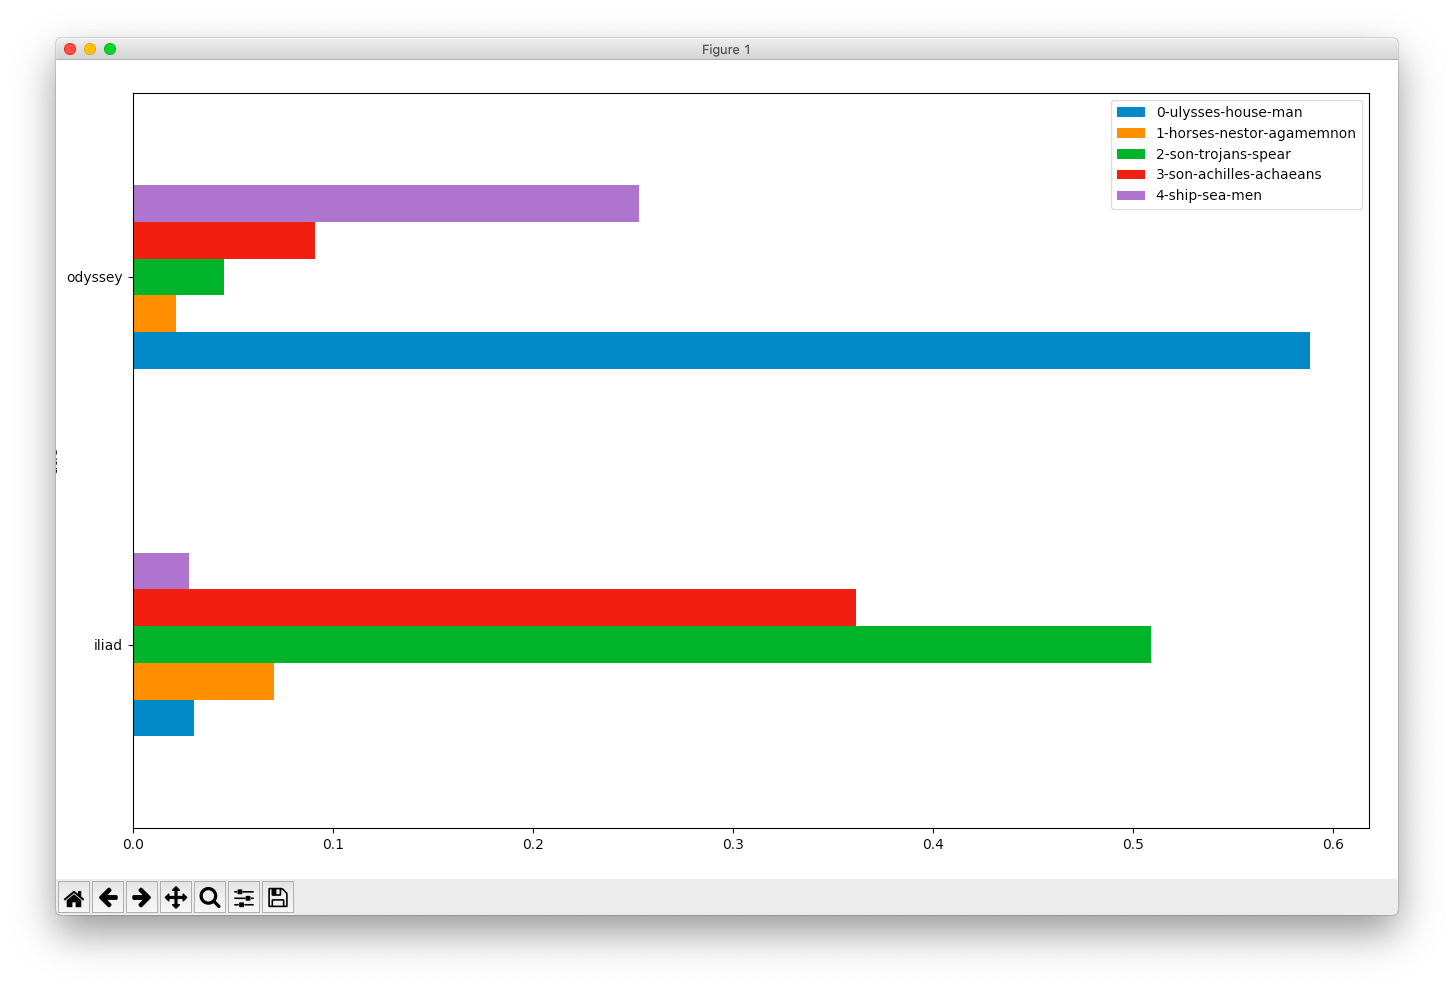
Because of a great feature in Topic Modeling Tool it is relatively easy to compare topics against metadata values such as authors, dates, formats, genres, etc. To accomplish this goal the raw numeric information output by the Tool (the actual model) needs to be supplemented with metadata, the data then needs to be pivoted, and subsequently visualized. This is a power-user’s recipe because it requires: 1) a specifically shaped comma-separated values (CSV) file, 2) Python and a few accompanying modules, and 3) the ability to work from the command line. That said, here’s a recipe to compare & contrast the two books of Homer:
- Copy the file named homer-books.csv to your computer’s desktop
- Click “Optional Settings…”; specify “Metadata File…” to be homer-books.csv; click “Ok”
- Click “Learn Topics”; the result ought to pretty much like your previous results, but the underlying model has been enhanced
- Copy the file named pivot.py to your computer’s desktop
- When the modeling is complete, open up a terminal application and navigate to your computer’s desktop
- Run the pivot program (
python pivot.py); the result ought to an error message outlining the input pivot.py expects - Run
pivot.pyagain, but this time give it input; more specifically, specify “./model/output_csv/topics-metadata.csv” as the first argument (Windows users will specify .\model\output_csv\topics-metadata.csv), specify “barh” for the second argument, and “title” as the third argument; the result ought to be a horizontal bar chart illustrating the differences in topics across the Iliad and the Odyssey, and ask yourself, “To what degree are the books similar?”
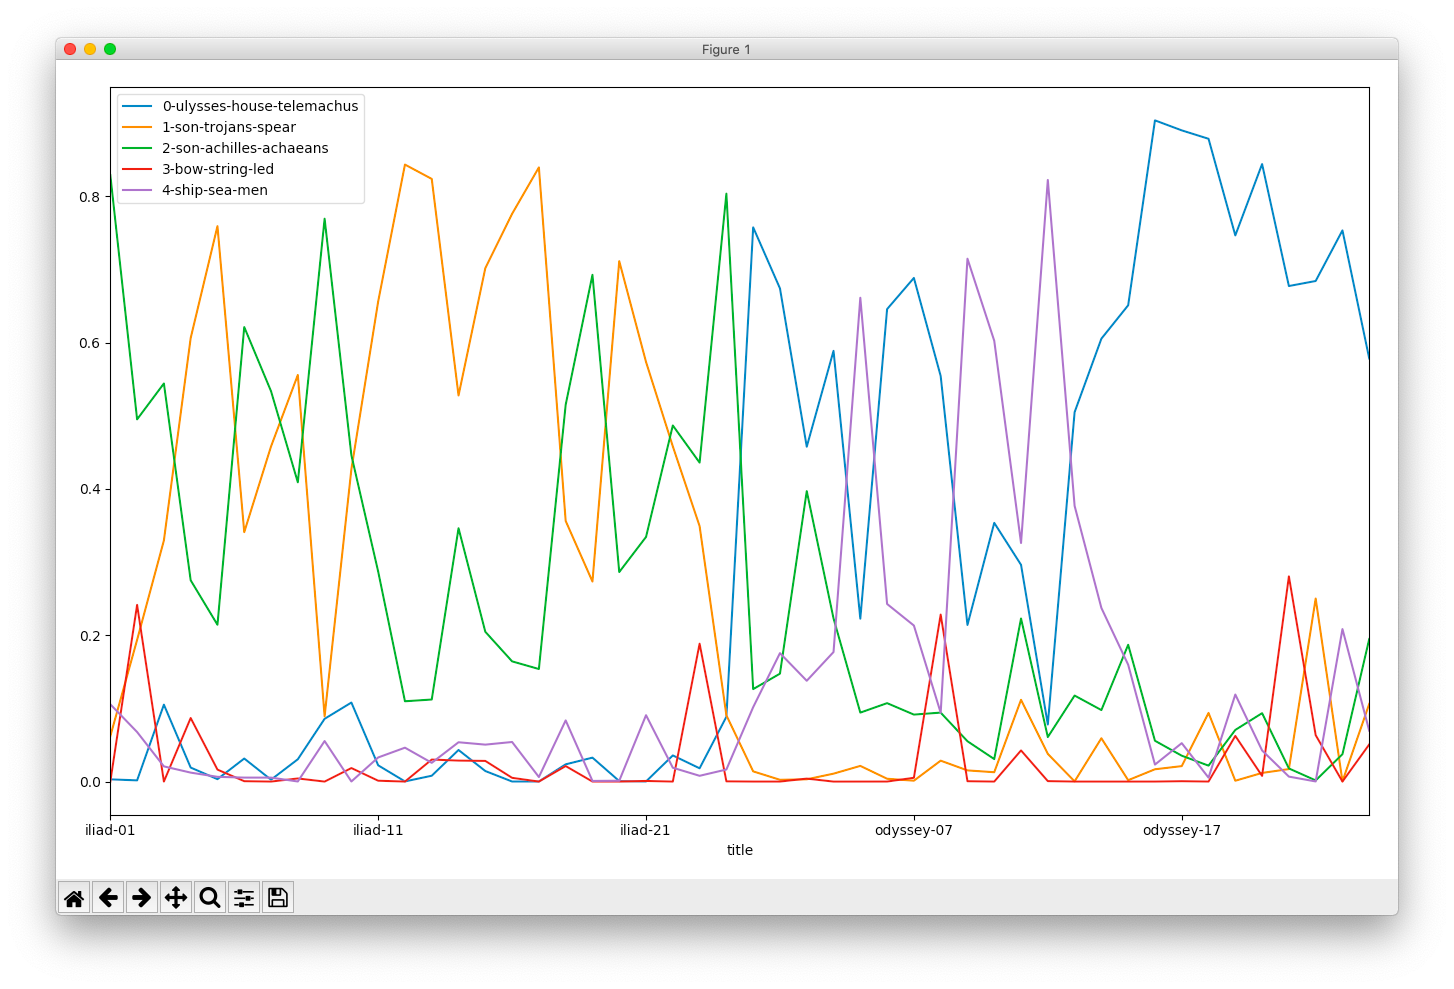
The following recipe is very similar to the previous recipe, but it illustrates the ebb & flow of topics throughout the whole of the two books:
- Copy the file named homer-chapters.csv to your computer’s desktop
- Click “Optional Settings…”; specify “Metadata File…” to be homer-chapters.csv; click “Ok”
- Click “Learn Topics”
- When the modeling is complete, open up a terminal application and navigate to your computer’s desktop
- Run
pivot.pyand specify “./model/output_csv/topics-metadata.csv” as the first argument (Windows users will specify .\model\output_csv\topics-metadata.csv), specify “line” for the second argument, and “title” as the third argument; the result ought to be a line chart illustrating the increase & decrease of topics from the beginning of the saga to the end, and ask yourself “What topics are discussed concurrently, and what topics are discussed when others are not?”
Topic modeling is an effective process for “reading” a corpus “from a distance”. Topic Modeling Tool makes the process easier, but the process requires practice. Next steps are for the student to play with the additional options behind the “Optional Settings…” dialog box, read the Tool’s documentation, take a look at the structure of the CSV/metadata file, and take a look under the hood at pivot.py.