Archive for the ‘Uncategorized’ Category

HathiTrust Resource Center Workset Browser

Posted on May 26, 2015 in Uncategorized

In my copious spare time I have hacked together a thing I’m calling the HathiTrust Research Center Workset Browser, a (fledgling) tool for doing “distant reading” against corpora from the HathiTrust. [1]

The idea is to: 1) create, refine, or identify a HathiTrust Research Center workset of interest — your corpus, 2) feed the workset’s rsync file to the Browser, 3) have the Browser download, index, and analyze the corpus, and 4) enable to reader to search, browse, and interact with the result of the analysis. With varying success, I have done this with a number of worksets ranging on topics from literature, philosophy, Rome, and cookery. The best working examples are the ones from Thoreau and Austen. [2, 3] The others are still buggy.

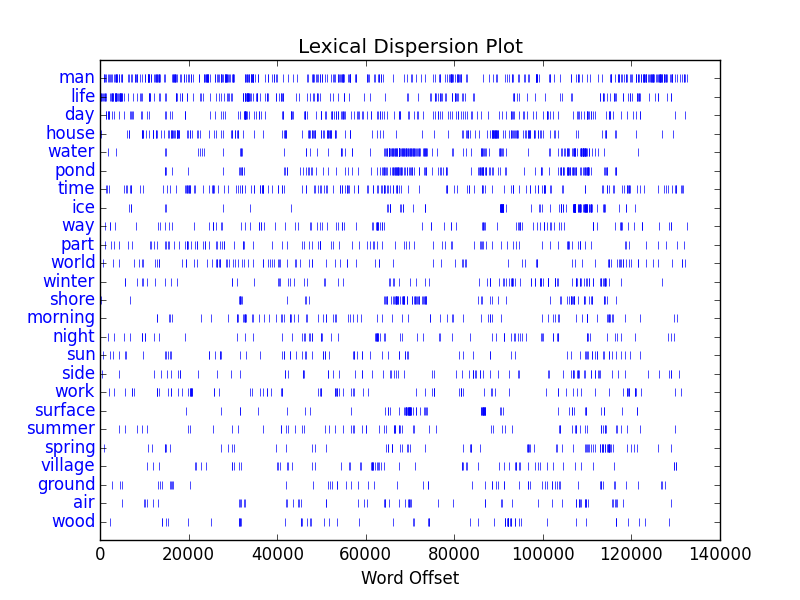
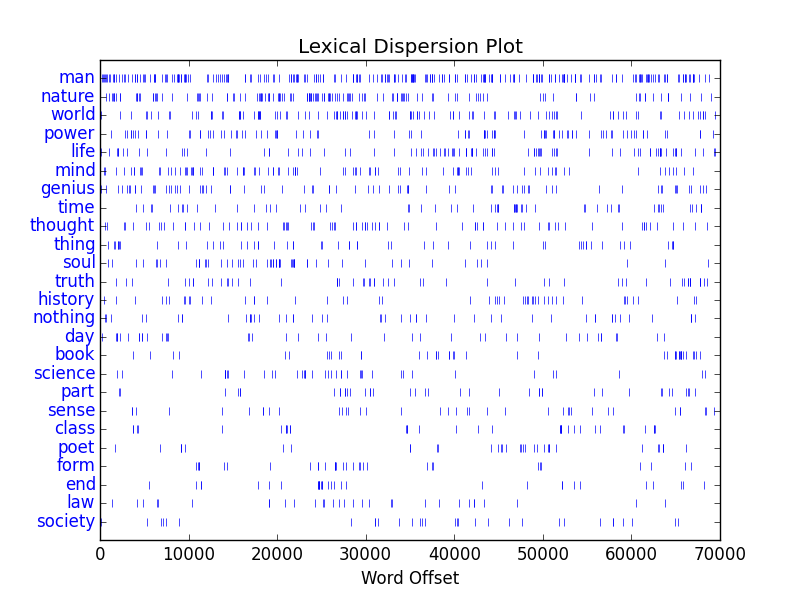
As a further example, the Browser can/will create reports describing the corpus as a whole. This analysis includes the size of a corpus measured in pages as well as words, date ranges, word frequencies, and selected items of interest based on pre-set “themes” — usage of color words, name of “great” authors, and a set of timeless ideas. [4] This report is based on more fundamental reports such as frequency tables, a “catalog”, and lists of unique words. [5, 6, 7, 8]

catalog

The whole thing is written in a combination of shell and Python scripts. It should run on just about any out-of-the-box Linux or Macintosh computer. Take a look at the code. [9] No special libraries needed. (“Famous last words.”) In its current state, it is very Unix-y. Everything is done from the command line. Lot’s of plain text files and the exploitation of STDIN and STDOUT. Like a Renaissance cartoon, the Browser, in its current state, is only a sketch. Only later will a more full-bodied, Web-based interface be created.

The next steps are numerous and listed in no priority order: putting the whole thing on GitHub, outputting the reports in generic formats so other things can easily read them, improving the terminal-based search interface, implementing a Web-based search interface, writing advanced programs in R that chart and graph analysis, provide a means for comparing & contrasting two or more items from a corpus, indexing the corpus with a (real) indexer such as Solr, writing a “cookbook” describing how to use the browser to to “kewl” things, making the metadata of corpora available as Linked Data, etc.

‘Want to give it a try? For a limited period of time, go to the HathiTrust Research Center Portal, create (refine or identify) a collection of personal interest, use the Algorithms tool to export the collection’s rsync file, and send the file to me. I will feed the rsync file to the Browser, and then send you the URL pointing to the results. [10] Let’s see what happens.

Fun with public domain content, text mining, and the definition of librarianship.

Links

  1. HTRC Workset Browser – http://bit.ly/workset-browser
  2. Thoreau – http://bit.ly/browser-thoreau
  3. Austen – http://bit.ly/browser-austen
  4. Thoreau report – http://bit.ly/browser-thoreau-about
  5. Thoreau dictionary (frequency list) – http://bit.ly/thoreau-dictionary
  6. usage of color words in Thoreau — http://bit.ly/thoreau-colors
  7. unique words in the corpus – http://bit.ly/thoreau-unique
  8. Thoreau “catalog” — http://bit.ly/thoreau-catalog
  9. source code – http://ntrda.me/1Q8pPoI
  10. HathiTrust Research Center Portal – https://sharc.hathitrust.org

Text files

Posted on March 11, 2015 in Uncategorized

While a rose is a rose is a rose, a text file is not a text file is not a text file.

For better or for worse, we here in our text analysis workshop are dealing with three different computer operating systems: Windows, Macintosh, and Linux. Text mining requires the subject of its analysis to be in the form of plain text files. [1] But there is a subtle difference between the ways each of our operating systems expect to deal with “lines” in that text. Let me explain.

Imagine a classic typerwriter. A cylinder (called a “platten”) fit into a “carriage” designed to move back & forth across a box while “keys” were slapped against a piece of inked ribbon ultimately imprinting a character on a piece of paper rolled around the platten. As each key was pressed the platten moved a tiny bit from right to left. When the platten got to the left-most position, the operator was expected to manually move the platten back to the right-most postion and continue typing. This movement was really two movements in one. First, the carriage was “returned” to the right-most position, and second, the platten was rolled one line up. (The paper was “fed” around the platten by one line.) If one or the other of these two movements were not performed, then the typing would either run off the right-hand side of the paper, or the letters would be imprinted on top of the previously typed characters. These two movements are called “carriage returns” and “line feeds”, respectively.

Enter computers. Digital representations of characters were saved to files. These files are then sent to printers, but there is no person there to manually move the platten from left to right nor to roll the paper further into the printer. Instead, invisible characters were created. There are many invisible characters, and the two of most interest to us are carriage return (ASCII character 13) and line feed (sometimes called “new line” and ASCII character 10). [2] When the printer received these characters the platten moved accordingly.

Enter our operating systems. For better or for worse, traditionally each of our operating systems treat the definition of lines differently:

  • in a traditional Macintosh file lines are delimited by a single carriage return (ASCII 13)
  • on Unix/Linux lines are delimited by line feeds (ASCII 10)
  • Windows computers expect lines to be delimited by a combination of both (ASCII 13 and ASCII 10)

Go figure?

Macintosh is much more like Unix now-a-days, so most Macintosh text files use the Unix convention.

Windows folks, remember how your text files looked funny when initially displayed? This is because the original text files only contained ASCII 10 and not ASCII 13. Notepad, your default text editor, did not “see” line feed characters and consequently everything looked funny. Years ago, if a Macintosh computer read a Unix/Linux text file, then all the letters would be displayed on top of each other, even messier.

If you create a text file on your Windows or (older) Macintosh computer, and then you use these files as input to other programs (ie., wget -i ./urls.txt), then the operation may fail because the programs may not know how a line is denoted in the input.

Confused yet? In any event, text files are not text files are not text files. And the solution to this problem is to use full-featured text editor — the subject of another essay.

[1] plain text files explained – http://en.wikipedia.org/wiki/Plain_text
[2] intro’ to ASCII – http://www.theasciicode.com.ar

Hands-on text analysis workshop

Posted on January 9, 2015 in Uncategorized

I have all but finished writing a hands-on text analysis workshop. From the syllabus:

The purpose of this 5­-week workshop is to increase the knowledge of text mining principles among participants. By the end of the workshop, students will be able to describe the range of basic text mining techniques (everything from the creation of a corpus, to the counting/tabulating of words, to classification & clustering, and visualizing the results of text analysis) and have garnered hands­-on experience with all of them. All the materials for this workshop are available online. There are no prerequisites except for two things: 1) a sincere willingness to learn, and 2) a willingness to work at a computer’s command line interface. Students are really encouraged to bring their own computers to class.

The workshop is divided into the following five, 90-minute sessions, one per week:

  1. Overview of text mining and working from the command line
  2. Building a corpus
  3. Word and phrase frequencies
  4. Extracting meaning with dictionaries, parts­of­speech analysis, and named entity recognition
  5. Classification and topic modeling

For better or for worse, the workshop’s computing environment will be the Linux command line. Besides the usual command-line suspects, participants will get their hands dirty with wget, tika, a bit of Perl, a lot of Python, Wordnet, Treetagger, Standford’s Named Entity Recognizer, and Mallet.

For more detail, see the syllabus, sample code, and corpus.

distance.cgi – My first Python-based CGI script

Posted on January 9, 2015 in Uncategorized

Yesterday I finished writing my first Python-based CGI script — distance.cgi. Given two words, it allows the reader to first disambiguate between various definitions of the words, and second, uses Wordnet’s network to display various relationships (distances) between the resulting “synsets”. (Source code is here.)

Reader input

Disambiguate

Display result

The script relies on Python’s Natural Language Toolkit (NLTK) which provides an enormous amount of functionality when it comes to natural language processing. I’m impressed. On the other hand, the script is not zippy, and I am not sure how performance can be improved. Any hints?

My second Python script, dispersion.py

Posted on November 19, 2014 in Uncategorized

This is my second Python script, dispersion.py, and it illustrates where common words appear in a text.

#!/usr/bin/env python2

# dispersion.py - illustrate where common words appear in a text
#
# usage: ./dispersion.py <file>

# Eric Lease Morgan <emorgan@nd.edu>
# November 19, 2014 - my second real python script; "Thanks for the idioms, Don!"


# configure
MAXIMUM = 25
POS     = 'NN'

# require
import nltk
import operator
import sys

# sanity check
if len( sys.argv ) != 2 :
  print "Usage:", sys.argv[ 0 ], "<file>"
  quit()
  
# get input
file = sys.argv[ 1 ]

# initialize
with open( file, 'r' ) as handle : text = handle.read()
sentences = nltk.sent_tokenize( text )
pos       = {}

# process each sentence
for sentence in sentences : 
  
  # POS the sentence and then process each of the resulting words
  for word in nltk.pos_tag( nltk.word_tokenize( sentence ) ) :
    
    # check for configured POS, and increment the dictionary accordingly
    if word[ 1 ] == POS : pos[ word[ 0 ] ] = pos.get( word[ 0 ], 0 ) + 1

# sort the dictionary
pos = sorted( pos.items(), key = operator.itemgetter( 1 ), reverse = True )

# do the work; create a dispersion chart of the MAXIMUM most frequent pos words
text = nltk.Text( nltk.word_tokenize( text ) )
text.dispersion_plot( [ p[ 0 ] for p in pos[ : MAXIMUM ] ] )

# done
quit()

I used the program to analyze two works: 1) Thoreau’s Walden, and 2) Emerson’s Representative Men. From the dispersion plots displayed below, we can conclude a few things:

  • The words “man”, “life”, “day”, and “world” are common between both works.
  • Thoreau discusses water, ponds, shores, and surfaces together.
  • While Emerson seemingly discussed man and nature in the same breath, but none of his core concepts are discussed as densely as Thoreau’s.
Thoreau's Walden

Thoreau’s Walden

Emerson's Representative Men

Emerson’s Representative Men

Python’s Natural Langauge Toolkit (NLTK) is a good library to get start with for digital humanists. I have to learn more though. My jury is still out regarding which is better, Perl or Python. So far, they have more things in common than differences.

My first R script, wordcloud.r

Posted on November 10, 2014 in Uncategorized

This is my first R script, wordcloud.r:

#!/usr/bin/env Rscript

# wordcloud.r - output a wordcloud from a set of files in a given directory

# Eric Lease Morgan <eric_morgan@infomotions.com>
# November 8, 2014 - my first R script!


# configure
MAXWORDS    = 100
RANDOMORDER = FALSE
ROTPER      = 0

# require
library( NLP )
library( tm )
library( methods )
library( RColorBrewer )
library( wordcloud )

# get input; needs error checking!
input <- commandArgs( trailingOnly = TRUE )
  
# create and normalize corpus
corpus <- VCorpus( DirSource( input[ 1 ] ) )
corpus <- tm_map( corpus, content_transformer( tolower ) )
corpus <- tm_map( corpus, removePunctuation )
corpus <- tm_map( corpus, removeNumbers )
corpus <- tm_map( corpus, removeWords, stopwords( "english" ) )
corpus <- tm_map( corpus, stripWhitespace )

# do the work
wordcloud( corpus, max.words = MAXWORDS, random.order = RANDOMORDER, rot.per = ROTPER )

# done
quit()

Given the path to a directory containing a set of plain text files, the script will generate a wordcloud.

Like Python, R has a library well-suited for text mining — tm. Its approach to text mining (or natural language processing) is both similar and dissimilar to Python’s. They are similar in that they both hope to provide a means for analyzing large volumes of texts. It is similar in that they use different underlying data structures to get there. R might be more for analytic person. Think statistics. Python may be more for the “literal” person, all puns intended. I will see if I can exploit the advantages of both.

My first Python script, concordance.py

Posted on November 10, 2014 in Uncategorized

Below is my first Python script, concordance.py:

#!/usr/bin/env python2

# concordance.py - do KWIK search against a text
#
# usage: ./concordance.py <file> <word>ph

# Eric Lease Morgan <emorgan@nd.edu>
# November 5, 2014 - my first real python script!


# require
import sys
import nltk

# get input; needs sanity checking
file = sys.argv[ 1 ]
word = sys.argv[ 2 ]

# do the work
text = nltk.Text( nltk.word_tokenize( open( file ).read( ) ) )
text.concordance( word )

# done
quit()

Given the path to a plain text file as well as a word, the script will output no more than twenty-five lines containing the given word. It is a keyword-in-context (KWIC) search engine, one of the oldest text mining tools in existence.

The script is my first foray into Python scripting. While Perl is cool (and “kewl”), it behooves me to learn the language of others if I expect good communication to happen. This includes others using my code and me using the code of others. Moreover, Python comes with a library (module) call the Natural Langauge Toolkit (NLTK) which makes it relatively easy to get my feet wet with text mining in this environment.

Lexicons and sentiment analysis – Notes to self

Posted on July 9, 2014 in Uncategorized

This is mostly a set of notes to myself on lexicons and sentiment analysis.

A couple of weeks ago I asked Jeffrey Bain-Conkin to read at least one article about sentiment analysis (sometimes called “opinion mining”), and specifically I asked him to help me learn about the use of lexicons in such a process. He came back with a few more articles and a list of pointers to additional information. Thank you, Jeffrey! I am echoing the list here for future reference, for the possible benefit of others, and to remove some of the clutter from my to-do list. While I haven’t read and examined each of the items in great detail, just re-creating the list increases my knowledge. The list is divided into three sections: lexicons, software, and “more”.

Lexicons

  • Arguing Lexicon – “The lexicon includes patterns that represent arguing.”
  • BOOTStrep Bio-Lexicon – “Biological terminology is a frequent cause of analysis errors when processing literature written in the biology domain. For example, ‘retro-regulate’ is a terminological verb often used in molecular biology but it is not included in conventional dictionaries. The BioLexicon is a linguistic resource tailored for the biology domain to cope with these problems. It contains the following types of entries: a set of terminological verbs, a set of derived forms of the terminological verbs, general English words frequently used in the biology domain, [and] domain terms.”
  • English Phrases for Information Retrieval – “Goal of the ‘English Phrases for IR’ (EP4IR) project at the Radboud University Nijmegen (The Netherlands) is the development of a grammar and lexicon of English suitable for applications in Information Retrieval and available in the public domain.”
  • General Inquirer – “The General Inquirer is basically a mapping tool. It maps each text file with counts on dictionary-supplied categories. The currently distributed version combines the ‘Harvard IV-4’ dictionary content-analysis categories, the ‘Lasswell’ dictionary content-analysis categories, and five categories based on the social cognition work of Semin and Fiedler, making for 182 categories in all. Each category is a list of words and word senses. A category such as ‘self references’ may contain only a dozen entries, mostly pronouns. Currently, the category ‘negative’ is our largest with 2291 entries. Users can also add additional categories of any size.”
  • NRC word-emotion association lexicon – “The lexicon has human annotations of emotion associations for more than 24,200 word senses (about 14,200 word types). The annotations include whether the target is positive or negative, and whether the target has associations with eight basic emotions (joy, sadness, anger, fear, surprise, anticipation, trust, disgust).” The URL also points to a large number of articles on sentiment analysis in general.
  • Subjectivity Lexicon – “The Subjectivity Lexicon (list of subjectivity clues) that is part of OpinionFinder…”
  • WordNet – “WordNet® is a large lexical database of English. Nouns, verbs, adjectives and adverbs are grouped into sets of cognitive synonyms (synsets), each expressing a distinct concept. Synsets are interlinked by means of conceptual-semantic and lexical relations. The resulting network of meaningfully related words and concepts can be navigated with the browser. WordNet is also freely and publicly available for download. WordNet’s structure makes it a useful tool for computational linguistics and natural language processing.”
  • WordNet Domains – “WordNet Domains is a lexical resource created in a semi-automatic way by augmenting WordNet with domain labels. WordNet Synsets have been annotated with at least one semantic domain label, selected from a set of about two hundred labels structured according the WordNet Domain Hierarchy. Information brought by domains is complementary to what is already in Wordnet. A domain may include synsets of different syntactic categories and from different WordNet sub-hierarchies. Domains may group senses of the same word into homogeneous clusters, with the side effect of reducing word polysemy in WordNet.”
  • WordNet-Affect – “WordNet-Affect is an extension of WordNet Domains, including a subset of synsets suitable to represent affective concepts correlated with affective words. Similarly to our method for domain labels, we assigned to a number of WordNet synsets one or more affective labels (a-labels). In particular, the affective concepts representing emotional state are individuated by synsets marked with the a-label emotion. There are also other a-labels for those concepts representing moods, situations eliciting emotions, or emotional responses. The resource was extended with a set of additional a-labels (called emotional categories), hierarchically organized, in order to specialize synsets with a-label emotion. The hierarchical structure of new a-labels was modeled on the WordNet hyperonym relation. In a second stage, we introduced some modifications, in order to distinguish synsets according to emotional valence. We defined four addictional a-labels: positive, negative, ambiguous, and neutral.”

Software / applications

  • Linguistic Inquiry and Word Count – “Linguistic Inquiry and Word Count (LIWC) is a text analysis software program designed by James W. Pennebaker, Roger J. Booth, and Martha E. Francis. LIWC calculates the degree to which people use different categories of words across a wide array of texts, including emails, speeches, poems, or transcribed daily speech. With a click of a button, you can determine the degree any text uses positive or negative emotions, self-references, causal words, and 70 other language dimensions.”
  • OpinionFinder – “OpinionFinder is a system that processes documents and automatically identifies subjective sentences as well as various aspects of subjectivity within sentences, including agents who are sources of opinion, direct subjective expressions and speech events, and sentiment expressions.”
  • SenticNet – “SenticNet is a publicly available semantic resource for concept-level sentiment analysis. The affective common-sense knowledge base is built by means of sentic computing, a paradigm that exploits both AI and Semantic Web techniques to better recognize, interpret, and process natural language opinions over the Web. In particular, SenticNet exploits an ensemble of graph-mining and dimensionality-reduction techniques to bridge the conceptual and affective gap between word-level natural language data and the concept-level opinions and sentiments conveyed by them. SenticNet is a knowledge base that can be employed for the development of applications in fields such as big social data analysis, human-computer interaction, and e-health.”
  • SPECIALIST NLP Tools – “The SPECIALIST Natural Language Processing (NLP) Tools have been developed by the The Lexical Systems Group of The Lister Hill National Center for Biomedical Communications to investigate the contributions that natural language processing techniques can make to the task of mediating between the language of users and the language of online biomedical information resources. The SPECIALIST NLP Tools facilitate natural language processing by helping application developers with lexical variation and text analysis tasks in the biomedical domain. The NLP Tools are open source resources distributed subject to these [specific] terms and conditions.”
  • Visual Sentiment Ontology – “The analysis of emotion, affect and sentiment from visual content has become an exciting area in the multimedia community allowing to build new applications for brand monitoring, advertising, and opinion mining. There exists no corpora for sentiment analysis on visual content, and therefore limits the progress in this critical area. To stimulate innovative research on this challenging issue, we constructed a new benchmark and database. This database contains a Visual Sentiment Ontology (VSO) consisting of 3244 adjective noun pairs (ANP), SentiBank a set of 1200 trained visual concept detectors providing a mid-level representation of sentiment, associated training images acquired from Flickr, and a benchmark containing 603 photo tweets covering a diverse set of 21 topics. This website provides the above mentioned material for download…”

Lists of additional information

  • Lexical databases and corpora – “This is a list of links to lexical databases and corpora, organized by language or language group. The resources on this page were initially compiled from announcements on the LINGUIST list and web-search results. This is not intended to be an exhaustive list, but rather a place to organize and store potentially useful links as I [Jen Smith] encounter them.”
  • Opinion Mining, Sentiment Analysis, and Opinion Spam Detection – a long list of links pointing to articles, etc. about opinion mining.
  • Sentiment Symposium Tutorial – “This tutorial covers all aspects of building effective sentiment analysis systems for textual data, with and without sentiment-relevant metadata like star ratings. We proceed from pre-processing techniques to advanced uses cases, assessing common approaches and identifying best practices.”

Summary

What did I learn? I learned that to do sentiment analysis, lexicons are often employed. I learned that to evaluate a corpus for a particular sentiment, a researcher first needs to create a lexicon embodying that sentiment. Each element in the lexicon then needs to be assigned a quantitative value. The lexicon is then compared to the corpus tabulating the occurrences. Once tabulated, scores can then be summed, measurements taken, observations made and graphed, and conclusions/judgments made. Correct? Again, thank you, Jeffrey!

“Librarians love lists.”

What’s Eric Reading?

Posted on July 4, 2014 in Uncategorized

I have resurrected an application/system of files used to archive and disseminate things (mostly articles) I’ve been reading. I call it What’s Eric Reading? From the original About page:

I have been having fun recently indexing PDF files.

For the pasts six months or so I have been keeping the articles I’ve read in a pile, and I was rather amazed at the size of the pile. It was about a foot tall. When I read these articles I “actively” read them — meaning, I write, scribble, highlight, and annotate the text with my own special notation denoting names, keywords, definitions, citations, quotations, list items, examples, etc. This active reading process: 1) makes for better comprehension on my part, and 2) makes the articles easier to review and pick out the ideas I thought were salient. Being the librarian I am, I thought it might be cool (“kewl”) to make the articles into a collection. Thus, the beginnings of Highlights & Annotations: A Value-Added Reading List.

The techno-weenie process for creating and maintaining the content is something this community might find interesting:

  1. Print article and read it actively.
  2. Convert the printed article into a PDF file — complete with embedded OCR — with my handy-dandy ScanSnap scanner.
  3. Use MyLibrary to create metadata (author, title, date published, date read, note, keywords, facet/term combinations, local and remote URLs, etc.) describing the article.
  4. Save the PDF to my file system.
  5. Use pdttotext to extract the OCRed text from the PDF and index it along with the MyLibrary metadata using Solr.
  6. Provide a searchable/browsable user interface to the collection through a mod_perl module.

Software is never done, and if it were then it would be called hardware. Accordingly, I know there are some things I need to do before I can truely deem the system version 1.0. At the same time my excitment is overflowing and I thought I’d share some geekdom with my fellow hackers.

Fun with PDF files and open source software.

Visualising Data: A Travelogue

Posted on June 17, 2014 in Uncategorized


Last month a number of us from the Hesburgh Libraries attended a day-long workshop on data visualisation facilitated by Andy Kirk of Visualising Data. This posting documents some of the things I learned.

First and foremost, we were told there are five steps to creating data visualisations. From the handouts and supplemented with my own understanding, they include:

  1. establishing purpose – This is where you ask yourself, “Why is a visualisation important here? What is the context of the visualization?
  2. acquiring, preparing and familiarising yourself with the data – Here were echoed different data types (open, nominal, ordinal, intervals, and ratios), and we were introduced to the hidden costs of massaging and enhancing data, which is something I do with text mining and others do in statistical analysis.
  3. establishing editorial focus – This is about asking and answering questions regarding the visualisation’s audience. What is their education level? How much time will they have to absorb the content? What medium(s) may be best used for the message?
  4. conceiving the design – Using just paper and pencil, draw, brainstorm, and outline the appearance of the visualisation.
  5. constructing the visualisation – Finally, do the work of making the visualisation a reality. Increasingly this work is done by exploiting the functionality of computers, specifically for the Web.

Here are a few meaty quotes:

  • Context is king.
  • Data preparation is a hidden cost in visualization.
  • Data visualisation is a tool for understanding, not fancy ways of showing numbers.
  • Data visualisation is about analysis and communication.

One of my biggest take-aways was the juxtaposition of two spectrum: reading to feeling, and explaining to exploring. In other words, to what degree is the visualization expected to be read or felt, and to what degree is it offering the possibilities to explain or explore the data? Kirk illustrated the idea like this:

                read
                 .
                / \
                 |
                 |
   explain <-----+-----> explore
                 |
                 |
                \ /
                 .
                feel

The the reading/feeling spectrum reminded me of the usability book entitled Don’t Make Me Think. The explaining/exploring spectrum made me consider interactivity in visualisations.

I learned two other things along the way: 1) creating visualisations is a team effort requiring a constellation of skilled people (graphic designers, statisticians, content specialists, computer technologists, etc.), and 2) is it entirely plausible to combine more than one graphic — data set illustration — into a single visualisation.

Now I just need to figure out how to put these visualisation techniques into practice.