This travelogue documents my experiences and what I learned on a tiny road trip including visits to Indiana University, Purdue University, University of Illinois / Urbana-Champagne, and Washington University In St. Louis between Monday, October 26 and Friday, October 30, 2017. In short, I learned four things: 1) of the places I visited, digital scholarship centers support a predictable set of services, 2) the University Of Notre Dame’s digital scholarship center is perfectly situated in the middle of the road when it comes to the services provided, 3) the Early Print Project is teamed with a set of enthusiastic & animated scholars, and 4) Illinois is very flat.
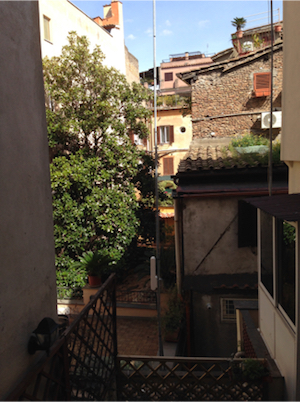
Four months ago I returned from a pseudo-sabbatical of two academic semesters, and exactly one year ago I was in Tuscany (Italy) painting cornfields & rolling hills. Upon my return I felt a bit out of touch with some of my colleagues in other libraries. At the same time I had been given an opportunity to participate in a grant-sponsored activity (the Early English Print Project) between Northwestern University, Washington University In St. Louis, and the University Of Notre Dame. Since I was encouraged to visit the good folks at Washington University, I decided to stretch a two-day visit into a week-long road trip taking in stops at digital scholarship centers. Consequently, I spent bits of time in Bloomington (Indiana), West Lafayette (Indiana), Urbana (Illinois), as well as St. Louis (Missouri). The whole process afforded me the opportunity to learn more and get re-acquainted.
Indiana University / Bloomington
My first stop was in Bloomington where I visited Indiana University, and the first thing that struck me was how much Bloomington exemplified the typical college town. Coffee shops. Boutique clothing stores. Ethnic restaurants. And teaming with students ranging from fraternity & sorority types, hippie wanna be’s, nerds, wide-eyed freshman, young lovers, and yes, fledgling scholars. The energy was positively invigorating.
My first professional visit was with Angela Courtney (Head of Arts & Humanities, Head of Reference Services, Librarian for English & American Literature, and Director of the Scholars’ Commons). Ms. Courtney gave me a tour of the library’s newly renovated digital scholarship center. [1] It was about the same size at the Hesburgh Libraries’s Center, and it was equipped with much of the same apparatus. There was a scanning lab, plenty of larger & smaller meeting spaces, a video wall, and lots of open seating. One major difference between Indiana and Notre Dame was the “reference desk”. For all intents & purposes, the Indiana University reference desk is situated in the digital scholarship center. Ms. Courtney & I chatted for a long hour, and I learned how Indiana University & the University Of Notre Dame were similar & different. Numbers of students. Types of library collections & services. Digital initiatives. For the most part, both universities have more things in common than differences, but their digital initiatives were by far more mature than the ones here at Notre Dame.
Later in the afternoon I visited with Yu (Marie) Ma who works for the HathiTrust Research Center. [2] She was relatively new to the HathiTrust, and if I understand her position correctly, then she spends a lot of her time setting up technical workflows and the designing the infrastructure for large-scale text analysis. The hour with Marie was informative on both of our parts. For example, I outlined some of the usability issues with the Center’s interface(s), and she outlined how the “data capsules” work. More specifically, “data capsules” are virtual machines operating in two different modes. In one mode a researcher is enabled to fill up a file system with HathiTrust content. In the other mode, one is enabled to compute against the content and return results. In one or the other of the modes (I’m not sure which), Internet connectivity is turned off to disable the leaking of HathiTrust content. In this way, a HathiTrust data capsule operates much like a traditional special collections room. A person can go into the space, see the book, take notes with a paper & pencil, and then leave sans any of the original materials. “What is old is new again.” Along the way Marie showed me a website — Lapps Grid — which looks as if it functions similar to Voyant Tools and my fledgling EEBO-TCP Workset Browser. [3, 4, 5] Amass a collection. Use the collection as input against many natural language processing tools/applications. Use the output as a means for understanding. I will take a closer look at Lapps Grid.
Purdue University
The next morning I left the rolling hills of southern Indiana for the flatlands of central Indiana and Purdue University. There I facilitated a brown-bag lunch discussion on the topic of scalable reading, but the audience seemed more interested in the concept of digital scholarship centers. I described the Center here at Notre Dame, and did my best to compare & contrast it with others as well as draw into the discussion the definition of digital humanities. Afterwards I went to lunch with Micheal Witt and Amanda Visconti. Mr. Witt spends much of his time on institutional repostory efforts, specifically in regards to scientific data. Ms. Visconti works in the realm of the digital humanities and has recently made available her very interesting interactive dissertation — Infinite Ulysses. [6] After lunch Mr. Witt showed me a new library space scheduled to open before the Fall Semester of 2017. The space will be library-esque during the day, and study-esque during the evening. Through the process of construction, some of their collection needed to be weeded, and I found the weeding process to be very interesting.
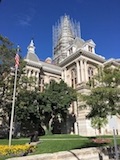
University of Illinois / Urbana-Champagne
Up again in the morning and a drive to Urbana-Champagne. During this jaunt I became both a ninny and a slave to my computer’s (telephone’s) navigation and functionality. First it directed me to my location, but no parking places. After identifying a parking place on my map (computer), I was not able to get directions on how to get there. Once I finally found parking, I required my telephone to pay. Connect to remote site while located in concrete building. Create account. Supply credit card number. Etc. We are increasingly reliant (dependent) on these gizmos.
My first meeting was with Karen Hogenboom (Associate Professor of Library Administration, Scholarly Commons Librarian and Head, Scholarly Commons). We too discussed digital scholarship centers, and again, there were more things in common with our centers than differences. Her space was a bit smaller than Notre Dame’s, and their space was less about specific services and more about referrals to other services across the library and across the campus. For example, geographic information systems services and digitization services were offered elsewhere.
I then had a date with an old book, but first some back story. Here at Notre Dame Julia Schneider brought to my attention a work written by Erasmus and commenting on Cato which may be a part of a project called The Digital Schoolbook. She told me how there were only three copies of this particular book, and one of them was located in Urbana. Consequently, a long month ago, I found a reference to the book in the library catalog, and I made an appointment to see it in person. The book’s title is Erasmi Roterodami libellus de co[n]structio[n]e octo partiu[m]oratio[n]is ex Britannia nup[er] huc plat[us] : et ex eo pureri bonis in l[ite]ris optio and it was written/published in 1514. [7, 8] The book represented at least a few things: 1) the continued and on-going commentary on Cato, 2) an example of early book printing, and 3) forms of scholarship. Regarding Cato I was only able to read a single word in the entire volume — the word “Cato” — because the whole thing was written in Latin. As an early printed book, I had to page through the entire volume to find the book I wanted. It was the last one. Third, the book was riddled with annotations, made from a number of hands, and with very fine-pointed pens. Again, I could not read a single word, but a number of the annotations were literally drawings of hands pointing to sections of interest. Whoever said writing in books was a bad thing? In this case, the annotations were a definite part of the scholarship.
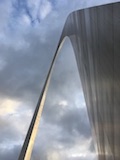
Washington University In St. Louis
Yet again, I woke up the next morning and continued on my way. Along the road there were billboards touting “foot-high pies” and attractions to Indian burial grounds. There were corn fields being harvested, and many advertisements pointing to Abraham Lincoln stomping locations.
Late that afternoon I was invited to participate in a discussion with Doug Knox, Steve Pentecost, Steven Miles, and Dr. Miles’s graduate students. (Mr. Knox & Mr. Pentecost work in a university space called Arts & Sciences Computing.) They outlined and reported upon a digital project designed to aid researchers & scholars learn about stelae found along the West River Basin in China. I listened. (“Stelae” are markers, usually made of stone, commemorating the construction or re-construction of religious temples.) To implement the project, TEI/XML files were being written and “en masse” used akin to a database application. Reports were to be written agains the XML to create digital maps as well as browsable lists of names of people, names of temples, dates, etc. I got to thinking how timelines might also be apropos.
The bulk of the following day (Friday) was spent getting to know a balance of colleagues and discussing the Early English Print Project. There were many people in the room: Doug Knox & Steve Pentecost from the previous day, Joesph Loewenstein (Professor, Department of English, Director Of the Humanities Digital Workshop and the Interdisciplinary Project in the Humanities) Kate Needham, Andrew Rouner (Digital Library Director), Anupam Basu (Assistant Professor, Department of English), Shannon Davis (Digital Library Services Manager), Keegan Hughes, and myself.
More specifically, we talked about how sets of EEBO/TCP ([9]) TEI/XML files can be: 1) corrected, enhanced, & annotated through both automation as well as crowd-sourcing, 2) supplemented & combined with newly minted & copy-right free facsimiles from the original printed documents, 3) analyzed & reported upon through text mining & general natural language processing techniques, and 4) packaged up & redistributed back to the scholarly community. While the discussion did not follow logically, it did surround a number of unspoken questions, such as but not limited to:
- Is METS a desirable re-distribution method? [10] What about some sort of database system instead?
- To what degree is governance necessary in order for us to make decisions?
- To what degree is it necessary to pour the entire corpus (more than 60,000 XML files with millions of nodes) into a single application for processing, and is the selected application up to the task?
- What form or flavor of TEI would be used as the schema for the XML file output?
- What role will an emerging standard called IIIF play in the process of re-distribution? [11]
- When is a corrected text “good enough” for re-distribution?
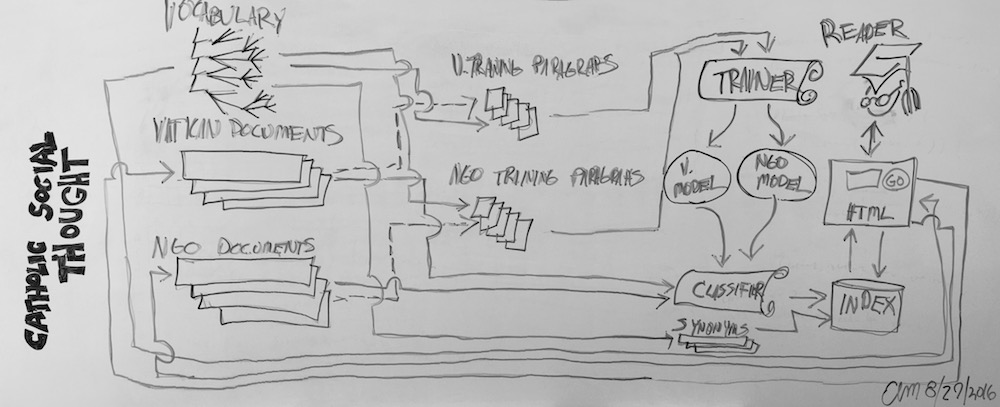
To my mind, none of these questions were answered definitively, but then again, it was an academic discussion. On the other hand, we did walk away with a tangible deliverable — a whiteboard drawing illustrating a possible workflow going something like this:
- cache data from University of Michigan
- correct/annotate the data
- when data is “good enough”, put the data back into the cache
- feed the data back to the University of Michigan
- when data is “good enough”, text mine the data and put the result to back into the cache
- feed the data back to the University of Michigan
- create new facsimiles from the printed works
- combine the facsimiles with the data, and put the result to back into the cache
- feed the data back to the University of Michigan
- repeat
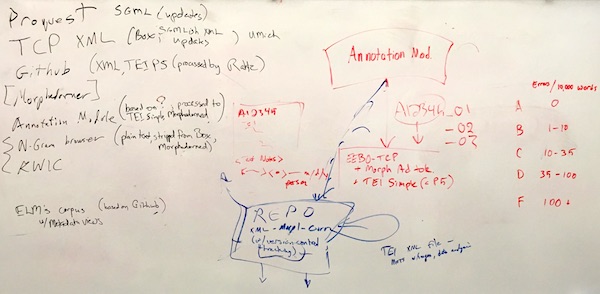
After driving through the country side, and after two weeks of reflection, I advocate a slightly different workflow:
- cache TEI data from GitHub repository, which was originally derived from the University of Michigan [12]
- make cache accessible to the scholarly community through a simple HTTP server and sans any intermediary application
- correct/annotate the data
- as corrected data becomes available, replace files in cache with corrected versions
- create copyright-free facsimiles of the originals, combine them with corrected TEI in the form of METS files, and cache the result
- use the METS files to generate IIIF manifests, and make the facsimiles viewable via the IIIF protocol
- as corrected files become available, use text mining & natural language processing to do analysis, combine the results with the original TEI (and/or facsimiles) in the form of METS files, and cache the result
- use the TEI and METS files to create simple & rudimentary catalogs of the collection (author lists, title lists, subject/keyword lists, date lists, etc.), making it easier for scholars to find and download items of interest
- repeat
The primary point I’d like to make in regard to this workflow is, “The re-distribution of our efforts ought to take place over simple HTTP and in the form of standardized XML, and I do not advocate the use of any sort of middle-ware application for these purposes.” Yes, of course, middle-ware will be used to correct the TEI, create “digital combos” of TEI and images, and do textual analysis, but the output of these processes ought to be files accessible via plain o’ ordinary HTTP. Applications (database systems, operating systems, content-management systems, etc.) require maintenance, and maintenance is done by a few & specialized number of people. Applications are often times “black boxes” understood and operated by a minority. Such things are very fragile, especially compared to stand-alone files. Standardized (XML) files served over HTTP are easily harvestable by anybody. They are easily duplicated. They can be saved on platform-independent media such as CD’s/DVD’s, magnetic tape, or even (gasp) paper. Once the results of our efforts are output as files, then supplementary distribution mechanisms can be put into place, such as IIIF or middleware database applications. XML files (TEI and/or METS) served over simple HTTP ought be the primary distribution mechanism. Such is transparent, sustainable, and system-independent.
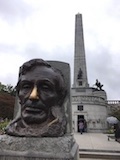
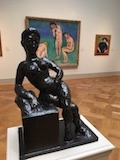
Over lunch we discussed Spenser’s Faerie Queene, the Washington University’s Humanities Digital Workshop, and the salient characteristics of digital humanities work. [13] In the afternoon I visited the St. Louis Art Museum, whose collection was rich. [14] The next day, on my way home through Illinois, I stopped at the tomb of Abraham Lincoln in order to pay my respects.
In conclusion
In conclusion, I learned a lot, and I believe my Americana road trip was a success. My conception and defintion of digital scholarship centers was re-enforced. My professional network was strengthened. I worked collaboratively with colleagues striving towards a shared goal. And my personal self was enriched. I advocate such road trips for anybody and everybody.
Links
[1] digital scholarship at Indiana University – https://libraries.indiana.edu/services/digital-scholarship
[2] HathiTrust Research Center – https://analytics.hathitrust.org
[3] Lapps Grid – http://www.lappsgrid.org
[4] Voyant Tools – http://voyant-tools.org
[5] EEBO-TCP Workset Browser – http://blogs.nd.edu/emorgan/2015/06/eebo-browser/
[6] Infinite Ulysses – http://www.infiniteulysses.com
[7] old book from the UIUC catalog – https://vufind.carli.illinois.edu/vf-uiu/Record/uiu_5502849
[8] old book from the Universal Short Title Catalogue – http://ustc.ac.uk/index.php/record/403362
[9] EEBO/TCP – http://www.textcreationpartnership.org/tcp-eebo/
[10] METS – http://www.loc.gov/standards/mets/
[11] IIIF – http://iiif.io
[12] GitHub repository of texts – https://github.com/textcreationpartnership/Texts
[13] Humanities Digital Workshop – https://hdw.artsci.wustl.edu
[14] St. Louis Art Museum – http://www.slam.org


 For the past year a number of us here in the Hesburgh Libraries at the University of Notre Dame have been working on a grant-sponsored project with others from Northwestern University and Washington University in St. Louis. Collectively, we have been calling our efforts the Early English Print Project, and our goal is to improve on the good work done by the Text Creation Partnership (TCP). [2]
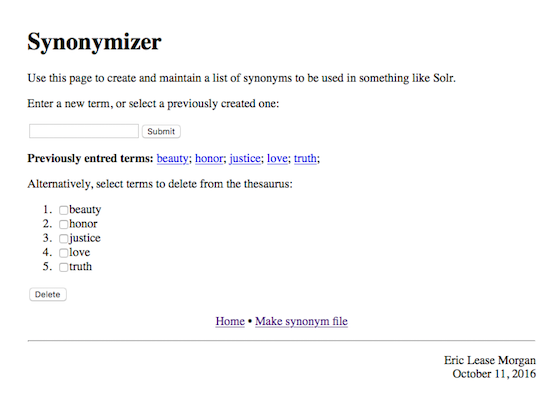
 How rare is rare? – In an effort to determine the “rarity” of items in the Catholic Portal, I programmatically searched WorldCat for specific items, counted the number of times it was held by libraries in the United States, and recorded the list of the holding libraries. Through the process I learned that most of the items in the Catholic Portal are “rare”, but I also learned that “rarity” can be defined as the triangulation of scarcity, demand, and value. Thus the “rare” things may not be rare at all.
 Have harvested the totality of the
  emerson
 thoreau