University of Notre Dame 3-D Printing Working Group

Posted on March 19, 2014 in Uncategorized by Eric Lease Morgan

This is the tiniest of blog postings describing a fledgling community here on campus called the University of Notre Dame 3-D Printing Working Group.

Working group

Working group

A few months ago Paul Turner said to me, “There are an increasing number of people across campus who are interested in 3-D printing. With your new space there in the Center, maybe you could host a few of us and we can share experiences.” Since then a few of us have gotten together a few times to discuss problems and solutions when it comes these relatively new devices. We have discussed things like:

  • what can these things be used for?
  • what are the advantages and disadvantages of different printers?
  • how and when does one charge for services?
  • what might the future of 3-D printing look like?
  • how can this technology be applied to the humanities?
nose

nose

Mike Elwell from Industrial Design hosted one of our meetings. We learned about “fab labs” and “maker spaces”. 3-D printing seems to be latest of gizmos for prototyping. He gave us a tour of his space, and I was most impressed with the laser cutter. At our most recent meeting Matt Leevy of Biology showed us how he is making models of people’s nasal cavities so doctors and practice before surgery. There I learned about the use of multiple plastics to do printing and how these multiple plastics can be used to make a more diverse set of objects. Because of the growing interest in 3-D printing, the Center will be hosting a beginner’s 3-D printing workshop in on March 28 from 1 – 5 o’clock and facilitated by graduate student Kevin Phaup.

With every get together there have been more and more people attending with faculty and staff from Biology, Industrial Design, the Libraries, Engineering, OIT, and Innovation Park. Our next meeting — just as loosely as the previous meetings — is scheduled for Friday, April 4 from noon to 1 o’clock in room 213 Stinson-Remick Hall. (That’s the new engineering building, and I believe it is the Notre Dame Design Deck space.) Everybody is welcome. The more people who attend, the more we can each get accomplished.

‘Hope to see you there!

CrossRef’s Prospect API

Posted on February 17, 2014 in Uncategorized by Eric Lease Morgan

This is the tiniest of blog postings outlining my experiences with a fledgling API called Prospect.

Prospect is an API being developed by CrossRef. I learned about it through both word-of-mouth as well as a blog posting by Eileen Clancy called “Easy access to data for text mining“. In a nutshell, given a CrossRef DOI via content negotiation, the API will return both the DOI’s bibliographic information as well as URL(s) pointing to the location of full text instances of the article. The purpose of the API is to provide a straight-forward method for acquiring full text content without the need for screen scraping.

I wrote a simple, almost brain-deal Perl subroutine implementing the API. For a good time, I put the subroutine into action in a CGI script. Enter a simple query, and the script will search CrossRef for full text articles, and return a list of no more than five (5) titles and their associated URL’s where you can get them in a number of formats.

screen shot
screen shot of CrossRef Prospect API in action

The API is pretty straight-forward, but the URLs pointing to the full text are stuffed into a “Links” HTTP header, and the value of the header is not as easily parseable as one might desire. Still, this can be put to good use in my slowly growing stock of text mining tools. Get DOI. Feed to one of my tools. Get data. Do analysis.

Fun with HTTP.

Analyzing search results using JSTOR’s Data For Research

Posted on February 17, 2014 in Uncategorized by Eric Lease Morgan

Introduction

Data For Research (DFR) is an alternative interface to JSTOR enabling the reader to download statistical information describing JSTOR search results. For example, using DFR a person can create a graph illustrating when sets of citations where written, create a word cloud illustrating the most frequently used words in a journal article, or classify sets of JSTOR articles according to a set of broad subject headings. More advanced features enable the reader to extract frequently used phrases in a text as well as list statistically significant keywords. JSTOR’s DFR is a powerful tool enabling the reader to look for trends in large sets of articles as well as drill down into the specifics of individual articles. This hands-on workshop leads the student through a set of exercises demonstrating these techniques.

Faceted searching

DFR supports an easy-to-use search interface. Enter one or two words into the search box and submit your query. Alternatively you can do some field searching using the advanced search options. The search results are then displayed and sortable by date, relevance, or a citation rank. More importantly, facets are displayed along side the search results, and searches can be limited by selecting one or more of the facet terms. Limiting by years, language, subjects, and disciplines prove to be the most useful.

screen shot
search results screen

Publication trends over time

By downloading the number of citations from multiple search results, it is possible to illustrate publication trends over time.

In the upper right-hand corner of every search result is a “charts view” link. Once selected it will display a line graph illustrating the number of citations fitting your query over time. It also displays a bar chart illustrating the broad subject areas of your search results. Just as importantly, there is a link at the bottom of the page — “Download data for year chart” — allowing you to download a comma-separated (CSV) file of publication counts and years. This file is easily importable into your favorite spreadsheet program and chartable. If you do multiple searches and download multiple CSV files, then you can compare publication trends. For example, the following chart compares the number of times the phrases “Henry Wadsworth Longfellow”, “Henry David Thoreau”, and “Ralph Waldo Emerson” have appeared in the JSTOR literature between 1950 and 2000. From the chart we can see that Emerson was consistently mentioned more of than both Longfellow and Thoreau. It would be interesting to compare the JSTOR results with the results from Google Books Ngram Viewer, which offers a similar service against their collection of digitized books.

chart view
chart view screen shot

publication trends
publications trends for Emerson, Thoreau, and Longfellow

Key word analysis

DFR counts and tabulates frequently used words and statistically significant key words. These tabulations can be used to illustrate characteristics of search results.

Each search result item comes complete with title, author, citation, subject, and key terms information. The subjects and key terms are computed values — words and phrases determined by frequency and statistical analysis. Each search result item comes with a “More Info” link which returns lists of the item’s most frequently used words, phrases, and keyword terms. Unfortunately, these lists often include stop words like “the”, “of”, “that”, etc. making the results not as meaningful as they could be. Still, these lists are somewhat informative. They allude to the “aboutness” of the selected article.

Key terms are also facets. You can expand the Key terms facets to get a small word cloud illustrating the frequency of each term across the entire search result. Clicking on one of the key terms limits the search results accordingly. You can also click on the Export button to download a CVS file of key terms and their frequency. This information can then be fed to any number of applications for creating word clouds. For example, download the CSV file. Use your text editor to open the CSV file, and find/replace the commas with colons. Copy the entire result, and paste it into Wordle’s advanced interface. This process can be done multiple times for different searches, and the results can be compared & contrasted. Word clouds for Longfellow, Thoreau, and Emerson are depicted below, and from the results you can quickly see both similarities and differences between each writer.

emerson
Ralph Waldo Emerson key terms

thoreau
Henry David Thoreau key terms

longfellow
Henry Wadsworth Longfellow key terms

Downloading complete data sets

If you create a DFR account, and if you limit your search results to 1,000 items or less, then you can download a data set describing your search results.

In the upper right-hand corner of the search results screen is a pull-down menu option for submitting data set requests. The resulting screen presents you with options for downloading a number of different types of data (citations, word counts, phrases, and key terms) in two different formats (CSV and XML). The CSV format is inherently easier to use, but the XML format seems to be more complete, especially when it comes to citation information. After submitting your data set request you will have to wait for an email message from DFR because it takes a while (anywhere from a few minutes to a couple of hours) for it to be compiled.

data set request
data set request page

After downloading a data set you can do additional analysis against it. For example, it is possible to create a timeline illustrating when individual articles where written. It is not be too difficult to create word clouds from titles or author names. If you have programming experience, then you might be be able to track ideas over time or the originator of specific ideas. Concordances — keyword in context search engines — can be implemented. Some of this functionality, but certainly not all, is being slowly implemented in a Web-based application called JSTOR Tool.

Summary

As the written word is increasingly manifested in digital form, so does the ability to evaluate the written word quantifiably. JSTOR’s DFR is one example of how this can be exploited for the purposes of academic research.

Note

A .zip file containing some sample data and well as the briefest of instructions on how to use it is linked from this document.

Paper Machines

Posted on January 22, 2014 in Uncategorized by Eric Lease Morgan

Today I learned about Paper Machines, a very useful plug-in for Zotero allowing the reader to do visualizations against their collection of citations.

Today Jeffrey Bain-Conkin pointed me towards a website called Lincoln Logarithms where sermons about Abraham Lincoln and slavery were analyzed. To do some of the analysis a Zotero plug-in called Paper Machines was used, and it works pretty well:

  1. make sure Zotero’s full text indexing feature is turned on
  2. download and install Paper Machines
  3. select one of your Zotero collections to be analyzed
  4. wait
  5. select any one of a number of visualizations to create

I am in the process of writing a book on linked data for archivists. I have am using Zotero to keep track the books citations, etc. I used Paper Machines to generate the following images:

word cloud
a word cloud where the words are weighted by a TF-IDF score

phrase net
a “phrase net” where the words are joined by the word “is”

topic model
a topic modeling map — illustration of automatically classified documents

From these visualizations I learned:

  • not much from the word cloud except what I already knew
  • the word “data” is connected to many different actions
  • I have few, if any, citations in my collection from the mid-2000’s

I have often thought collections of metadata (citations, MARC records, the output from JSTOR’s Data For Research service) could easily be evaluated and visualized. Paper Machines does just that. I wish I had done it. (To some extent, I have, but the work is fledgling and called JSTOR Tool.)

In any event, if you use Zotero, then I suggest you give Paper Machines a try.

Simple text analysis with Voyant Tools

Posted on January 18, 2014 in Uncategorized by Eric Lease Morgan

Voyant Tools is a Web-based application for doing a number of straight-forward text analysis functions, including but not limited to: word counts, tag cloud creation, concordancing, and word trending. Using Voyant Tools a person is able to read a document “from a distance”. It enables the reader to extract characteristics of a corpus quickly and accurately. Voyant Tools can be used to discover underlying themes in texts or verify propositions against them. This one-hour, hands-on workshop familiarizes the student with Voyant Tools and provides a means for understanding the concepts of text mining. (This document is also available as a PDF document suitable for printing.)

Getting started

Voyant Tools is located at http://voyant-tools.org, and the easiest way to get started is by pasting into its input box a URL or a blob of text. For learning purposes, enter one of the URL’s found at the end of this document, select from Thoreau’s Walden, Melville’s Moby Dick, or Twain’s Eve’s Diary, or enter a URL of your own choosing. Voyant Tools can read the more popular file formats, so URL’s pointing to PDF, Word, RTF, HTMl, and XML files will work well. Once given a URL, Voyant Tools will retrieve the associated text and do some analysis. Below is what is displayed when Walden is used as an example.

Voyant Tools
Voyant Tools

In the upper left-hand corner is a word cloud. In the lower-left hand corner are some statistics. The balance of the screen is made up of the text. The word cloud probably does not provide you with very much useful information because stop words have not been removed from the analysis. By clicking on the word cloud customization link, you can choose from a number of stop word sets, and the result will make much more sense. Figure #2 illustrates the appearance of the word cloud once the English stop words are employed.

By selecting words from the word cloud a word trends graph appears illustrating the relative frequency of the selection compared to its location in the text. You can use this tool to determine the consistency of the theme throughout the text. You can compare the frequency of additional words by entering them into the word trends search box. Figure #3 illustrates the frequency of the words pond and ice.

word cloud
Figure 2 – word cloud
word trends
Figure 3 – word trends
concordance
Figure 4 – concordance

Once you select a word from the word cloud, a concordance appears in the lower right hand corner of the screen. You can use this tool to: 1) see what words surround your selected word, and 2) see how the word is used in the context of the entire work. Figure #4 is an illustration of the concordance. The set of horizontal blue lines in the center of the screen denote where the selected word is located in the text. The darker the blue line is the more times the selected word appears in that area of the text.

What good is this?

On the surface of things you might ask yourself, “What good is this?” The answer lies in your ability to ask different types of questions against a text — questions you may or may not have been able to ask previously but are now able to ask because things like Voyant Tools count and tabulate words. Questions like:

  • What ara the most frequently used words in a text?
  • What words do not appear at all or appear infrequently?
  • Do any of these words represent any sort of theme?
  • Where do these words appear in the text, and how they compare to their synonyms or antonyms?
  • Where should a person go looking in the text for the use of particular words or their representative themes?

More features

Voyant Tools includes a number of other features. For example, multiple URLs can be entered into the home page’s input box. This enables the reader to examine many documents all at one time. (Try adding all the URLs at the end of the document.) After doing so many of the features of Voyant Tools work in a similar manner, but others become more interesting. For example, the summary pane in the lower left corner allows you to compare words across documents. (Consider applying stop words feature to the pane in order to make things more meaningful.) Each of Voyant Tools’ panes can be exported to HTML files or linked from other documents. This is facilitated by clicking on the small icons in the upper right-hand corner of each pane. Use this feature to embed Voyant illustrations into Web pages or printed documents. By exploring the content of a site called Hermeneuti.ca (http:/hermeneuti.ca) you can discover other features of Voyant Tools as well as other text mining applications.

The use of Voyant Tools represents an additional way of analyzing text(s). By counting and tabulating words, it provides a quick and easy quantitative method for learning what is in a text and what it might have to offer. The use of Voyant Tools does not offer “truth” per se, only new ways at observation.

Sample links

[1] Walden – http://infomotions.com/etexts/philosophy/1800-1899/thoreau-walden-186.txt
[2] Civil Disobedience – http://infomotions.com/etexts/philosophy/1800-1899/thoreau-life-183.txt
[3] Merrimack River – http://infomotions.com/etexts/gutenberg/dirs/etext03/7cncd10.txt

Semantic Web in Libraries 2013

Posted on December 30, 2013 in Uncategorized by Eric Lease Morgan

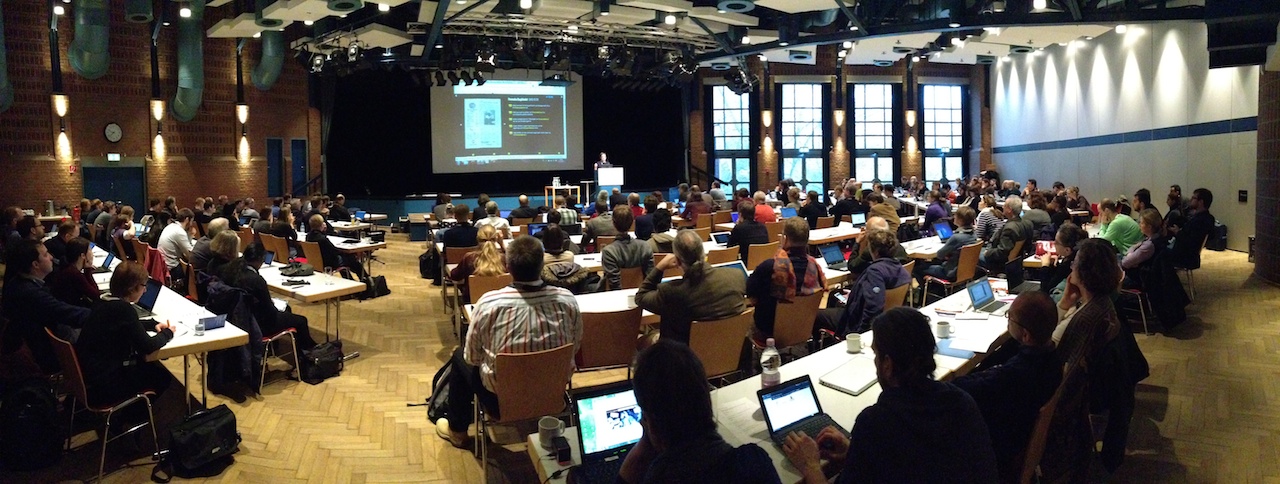
I attended the Semantic Web in Libraries 2013 conference in Hamburg (November 25-27), and this posting documents some of my experiences. In short, I definitely believe the linked data community in libraries is maturing, but I still wonder whether or not barrier for participation is really low enough for the vision of the Semantic Web to become a reality.

venue

Preconference on provenance

On the first day I attended a preconference about linked data and provenance led by Kai Eckert (University of Mannheim) and Magnus Pfeffer (Stuttgarat Media University). One of the fundamental ideas behind the Semantic Web and linked data is the collecting of triples denoting facts. These triples are expected to be amassed and then inferenced across in order to bring new knowledge to light. But in the scholarly world it is important cite and attribute scholarly output. Triples are atomistic pieces of information: subjects, predicates, objects. But there is no room in these simple assertions to denote where the information originated. This issue was the topic of the preconference discussion. Various options were outlined but none of them seemed optimal. I’m not sure of the conclusion, but one “solution” may be the use of PROV, “a model, corresponding serializations and other supporting definitions to enable the inter-operable interchange of provenance information in heterogeneous environments such as the Web”.

castle

Day #1

Both Day #1 and Day #2 were peppered with applications which harvested linked data (and other content) to create new and different views of information. AgriVIVO, presented by John Fereira (Cornell University) was a good example:

AgriVIVO is a search portal built to facilitate connections between all actors in the agricultural field, bridging across separately hosted directories and online communities… AgriVIVO is based on the VIVO open source semantic web application initially developed at Cornell University and now adopted by several cross-institutional research discovery projects.

Richard Wallis (OCLC) advocated the creation of library knowledge maps similar to the increasingly visible “knowledge graphs” created by Google and displayed at the top of search results. These “graphs” are aggregations of images, summaries, maps, and other bit of information providing the reader with answers / summaries describing what may be the topic of search. They are the same sort of thing one sees when searches are done in Facebook as well. And in the true spirit of linked data principles, Wallis advocated the additional use of additional peoples’ Semantic Web ontologies such as the ontology used by Schema.org. If you want to participate and help extend the bibliographic entities of Schema.org, then consider participating in a W3C Community called Schema Bib Extend Community Group.

BIBFRAME was described by Julia Hauser (Reinhold Heuvelmann German National Library). Touted as as a linked data replacement for MARC, its data model consists of works, instances, authorities, and annotations (everything else). According to Hauser, “The big unknown is how can RDA or FRBR be expressed using BIBFRAME.” Personally, I noticed how BIBFRAME contains no holdings information, but such an issue may be resolvable through the use of schema.org.

“Language effects hierarchies and culture comes before language” were the concluding remarks in a presentation by the National Library of Finland. Leaders in the linked data world, the presenters described how they were trying to create a Finnish ontology, and they demonstrated how language does not fit into neat and orderly hierarchies and relationships. Things always get lost in translation. For example, one culture may have a single word for a particular concept, but another culture may have multiple words because the concept has more nuances in its experience. Somewhere along the line the presenters alluded to onki-light, “a REST-style API for machine and Linked Data access to the underlying vocabulary data.” I believe the presenters were using this tool to support access to their newly formed ontology.

Yet another ontology was described by Carsten Klee (Berlin State Library) and Jakob Voẞ (GBV Common Library Network). This was a holdings ontology which seemed unnecessarily complex to me, but then I’m no real expert. See the holding-ontology repository on Github.

memorial

Day #2

I found the presentation — “Decentralization, distribution, disintegration: Towards linked data as a first class citizen in Library Land” — by Martin Malmsten (National Library of Sweden) to be the most inspiring. In the presentation he described why he thinks linked data is the way to describe the content of library catalogs. He also made insightful distinctions between file formats and the essencial characteristics of data, information, knowledge, (and maybe wisdom). Like many at the conference, he advocated interfaces to linked data, not MARC:

Working with RDF has enabled me to see beyond simple formats and observe the bigger picture — “Linked data or die”. Linked data is the way to do it now. I advocate the abstraction of MARC to RDF because RDF is more essencial and fundmental… Mixing data is new problem with the advent of linked data. This represents a huge shift in our thinking of Library Land. It is transformative… Keep the formats (monsters and zombies) outside your house. Formats are for exchange. True and real RDF is not a format.

Some of the work demonstrating the expressed ideas of the presentation is available on Github in a package called librisxl.

Another common theme / application demonstrated at the conference were variations of the venerable library catalog. OpenCat, presented by Agnes Simon (Bibliothéque Nationale de France), was an additional example of this trend. Combining authority data (available as RDF) provided by the National Library of France with works of a second library (Fresnes Public Library), the OpenCat prototype provides quite an interesting interface to library holdings.

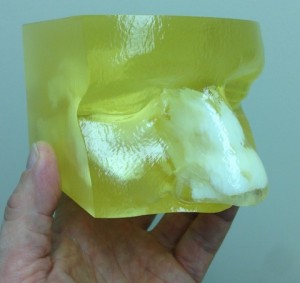
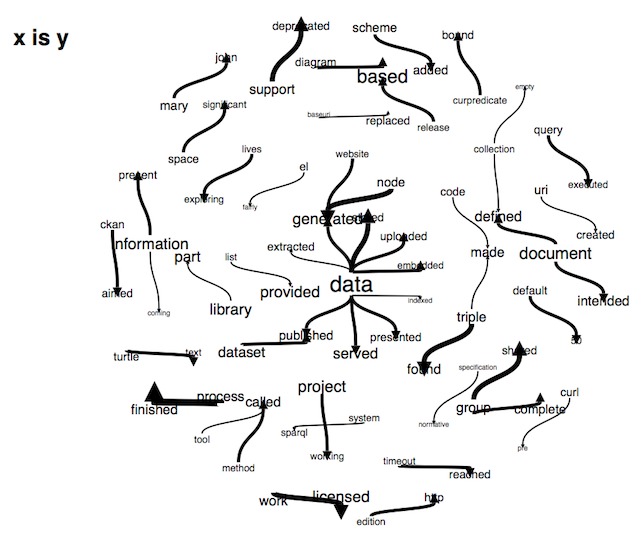
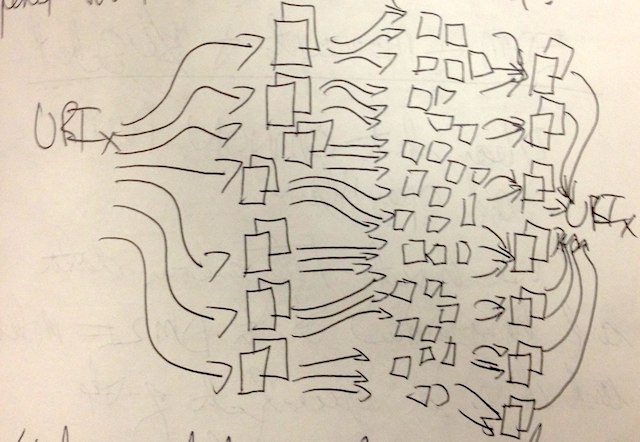
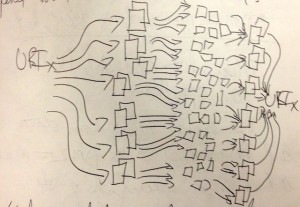
Peter Király (Europeana Foundation) described how he is collecting content over many protocols and amalgamating it into the data store of Europenana. I appreciated the efforts he has made to normalize and enrich the data — not an easy task. The presentation also made me think about provenance. While provenance is important, maybe trust of provenance can come from the aggregator. I thought, “If these aggregators believe — trust — the remote sources, then may be I can too.” Finally, the presentation got me imagining how one URI can lead to others, and my goal would be to distill it down again into a single URI all of the interesting information I found a long the way, as in the following image I doodled during the presentation.

uri

Enhancing the access and functionality of manuscripts was the topic of the presentation by Kai Eckert (Universität Mannheim). Specifically, manuscripts are digitized and an interface is placed on top allowing scholars to annotate the content beneath. I think the application supporting this functionality is called Pundit. Along the way he takes heterogeneous (linked) data and homogenizes it with a tool called DM2E.

OAI-PMH was frequently alluded to during the conference, and I have some ideas about that. In “Application of LOD to enrich the collection of digitized medieval manuscripts at the University of Valencia” Jose Manuel Barrueco Cruz (University of Valencia) described how the age of his content inhibited his use of the currently available linked data. I got the feeling there was little linked data closely associated with the subject matter of his manuscripts. Still, an an important thing to note, is how he started his investigations with the use of Datahub:

a data management platform from the Open Knowledge Foundation, based on the CKAN data management system… [providing] free access to many of CKAN’s core features, letting you search for data, register published datasets, create and manage groups of datasets, and get updates from datasets and groups you’re interested in. You can use the web interface or, if you are a programmer needing to connect the Datahub with another app, the CKAN API.

Simeon Warner (Cornell University) described how archives or dumps of RDF triple stores are synchronized across the Internet via HTTP GET, gzip, and a REST-ful interface on top of Google sitemaps. I was impressed because the end result did not necessarily invent something new but rather implemented an elegant solution to a real-world problem using existing technology. See the resync repository on Github.

In “From strings to things: A linked data API for library hackers and Web developers” Fabian Steeg and Pascal Christoph (HBZ) described an interface allowing librarians to determine the URIs of people, places, and things for library catalog records. “How can we benefit from linked data without being linked data experts? We want to pub Web developers into focus using JSON for HTTP.” There are few hacks illustrating some of their work on Github in the lobid repository.

Finally, I hung around for a single lightning talk — Carsten Klee’s (Berlin State Library) presentation of easyM2R, a PHP script converting MARC to any number of RDF serializations.

church

Observations, summary, and conclusions

I am currently in the process of writing a short book on the topic of linked data and archives for an organization called LiAM — “a planning grant project whose deliverables will facilitate the application of linked data approaches to archival description.” One of my goals for attending this conference was to determine my level of understanding when it comes to linked data. At the risk of sounding arrogant, I think I’m on target, but at the same time, I learned a lot at this conference.

For example, I learned that the process of publishing linked data is not “rocket surgery” and what I have done to date is more than functional, but I also learned that creating serialized RDF from MARC or EAD is probably not the best way to create RDF. I learned that publishing linked data is only one half of the problem to be solved. The other half is figuring out ways to collect, organize, and make useful the published content. Fortunately this second half of the problem was much of what the conference was about. Many people are using linked data to either create or enhance “next-generation library catalogs”. In this vein they are not really doing anything new and different; they are being evolutionary. Moreover, many of the developers are aggregating content using quite a variety of techniques, OAI-PMH being one of the more frequent.

When it comes to OAI-PMH and linked data, I see very much the same vision. Expose metadata in an agreed upon format and in an agreed upon method. Allow others to systematically harvest the metadata. Provide information services against the result. OAI-PMH was described as protocol with a low barrier to entry. The publishing of linked data is also seen as low barrier technology. The challenges of both first lie the vocabularies used to describe the things of the metadata. OAI-PMH required Dublin Core but advocated additional “ontologies”. Few people implemented them. Linked data is not much different. The problem with the language of the things is just as prevalent, if not more so. Linked data is not just the purview of Library Land and a few computer scientists. Linked data has caught the attention of a much wider group of people, albiet the subject is still a bit esoteric. I know the technology supporting linked data functions. After all, it is the technology of the Web. I just wonder if: 1) there will ever be a critical mass of linked data available in order to fulfill its promise, and 2) will we — the information community — be able to overcome the “Tower of Babel” we are creating with all the the various ontologies we are sporting. A single ontology won’t work. Just look at Dublin Core. Many ontologies won’t work either. There is too much variation and too many idiosyncrasies in real-world human language. I don’t know what the answer is. I just don’t.

Despite some of my misgivings, I think the following quote by Martin Malmsten pretty much sums up much of the conference — Linked data or die!

Fun with bibliographic indexes, bibliographic data management software, and Z39.50

Posted on November 15, 2013 in Uncategorized by Eric Lease Morgan

It is not suppose to be this hard.

The problem to solve

A student came into the Center For Digital Scholarship here at Notre Dame. They wanted to do some text analysis against a mass of bibliographic citations from the New York Times dating from 1934 to the present. His corpus consists of more than 1.6 million records. The student said, “I believe the use of words like ‘trade’ and ‘tariff’ have changed over time, and these changes reflect shifts in our economic development policies.” Sounds interesting to me, really.

Solution #1

To do this analysis I needed to download the 1.6 million records in question. No, I wasn’t going to download them in one whole batch but rather break them up into years. Still this results in individual data sets totaling thousands and thousands of records. Selecting these records through the Web interface of the bibliographic vendor was tedious. No, it was cruel and unusual punishment. There had to be a better way. Moreover, the vendor said, “Four thousand (4,000) records is the most a person can download at any particular time.”

Solution #2

After a bit of back & forth a commercial Z39.50 client seemed to be the answer. At the very least there won’t be a whole lot of clicking going on. I obtained a username/password combination. I figured out the correct host name of the remote Z39.50 server. I got the correct database name. I configured my client. Searches worked perfectly. But upon closer inspection, no date information was being parsed from the records. No pagination. The bibliographic citation management software could not create… bibliographic citations. “Is date information being sent? What about pagination and URLs?” More back & forth and I learned that the bibliographic vendor’s Z39.50 server outputs MARC, and the required data is encoded in the MARC. I went back to tweaking my client’s configuration. Everything was now working, but downloading the citations was very slow — too slow.

Solution #3

So I got to more thinking. “I have all the information I need to use a low-level Z39.50 client.” Yaz-client might be an option, but in the end I wrote my own Perl script. In about twenty-five lines of code I wrote what I needed, and downloads were a factor of 10 faster than the desktop client. (See the Appendix.) The only drawback was the raw MARC that I was saving. I would need to parse it for my student.

Back to the drawing board

Everything was going well, but then I hit the original limit — the record limit. When the bibliographic database vendor said there was a 4,000 record limit, I thought that meant no more than 4,000 records could be downloaded at one time. No, it means that from any given search I can only download the first 4,000 records. Trying to retrieve record 4,001 or greater results in an error. This is true. When I request record 4001 from my commercial client or Perl-based client I get an error. Bummer!

The only thing I can do now is ask the bibliographic vendor for a data dump.

Take-aways

On one hand I can’t blame the bibliographic vendor too much. For decades the library profession has been trying to teach people to do the most specific, highly accurate, precision/recall searches possible. “Why would anybody want more than a few dozen citations anyway? Four thousand ought to be plenty.” One the other hand, text mining is a legitimate and additional method for dealing with information overload. Four thousand records is just a tip of an iceberg.

I learned a few things:

  • many students have very interesting senior projects
  • the commercial Z39.50 client works quite well and is well-supported
  • many commercial Z30.50 implementations are based on the good work of Indexdata
  • my bibliographic database vendor does IP-based Z39.50 authentication

I also got an idea — provide my clientele with a “smart” database search interface. Here’s how:

  1. authenticate a person
  2. allow the person to select one or more bibliographic databases to search
  3. allow the person to enter a rudimentary, free text query
  4. search the selected databases
  5. harvest the results (of potentially thousand’s of records)
  6. do text mining against the results to create timelines, word clouds, author recommendations, etc.
  7. present the results to the person for analysis

Wish me luck!?

Appendix

#!/usr/bin/perl

# nytimes-search.pl - rudimentary z39.50 client to query the NY Times

# Eric Lease Morgan <emorgan@nd.edu>
# November 13, 2013 - first cut; "Happy Birthday, Steve!"

# usage: ./nytimes-search.pl > nytimes.marc


# configure
use constant DB     => 'hnpnewyorktimes';
use constant HOST   => 'fedsearch.proquest.com';
use constant PORT   => 210;
use constant QUERY  => '@attr 1=1016 "trade or tariff"';
use constant SYNTAX => 'usmarc';

# require
use strict;
use ZOOM;

# do the work
eval {

	# connect; configure; search
	my $conn = new ZOOM::Connection( HOST, PORT, databaseName => DB );
	$conn->option( preferredRecordSyntax => SYNTAX );
	my $rs = $conn->search_pqf( QUERY );

	# requests > 4000 return errors
	# print $rs->record( 4001 )->raw;
			
	# retrieve; will break at record 4,000 because of vendor limitations
	for my $i ( 0 .. $rs->size ) {
	
		print STDERR "\tRetrieving record #$i\r";
		print $rs->record( $i )->raw;
		
	}
		
};

# report errors
if ( $@ ) { print STDERR "Error ", $@->code, ": ", $@->message, "\n" }

# done
exit;

Network Detroit and Great Lakes THATCamp

Posted on October 5, 2013 in Uncategorized by Eric Lease Morgan

This time last week I was in Detroit (Michigan) where I attended Network Detroit and the Great Lakes THATCamp. This is the briefest of postings describing my experiences.

Network Detroit brought together experienced and fledgling digital humanists from around the region. There were presentations by local libraries, archives, and museums. There were also presentations by scholars and researchers. People were creating websites, doing bits of text mining, and trying to figure out how to improve upon the scholarly communications process. A few useful quotes included:

  • Design is a communication of knowledge. —Rebecca Tegtmeyer
  • Stop calling it DH… Show how DH supports the liberal arts… Build a support model… Integrate DH into the curriculum. —William Pannapacker
  • Analytic brillance is no longer the only game in town. —Lior Shamir
  • Provenance verification, knowledge representation, and staffing are the particular challenges when it come to making archival material accessible. —Arjun Sabharwal
  • Commenting should be a part of any museum’s website. —Adrienne Aluzzo

Day #2 consisted of participation in the Great Lakes THATCamp. I spend the time doing three things. First, I spent time thinking about a program I’m writing called PDF2TXT or maybe “Distant Reader”. The original purpose of the program is/was to simply extract the text from a PDF document. Since then it has succumbed to creeping featuritis to include the reporting of things like: readability scores, rudimentary word clouds of uni- and bi-grams, an extraction of the most frequent verb lemmings and the listing of sentences where they are found, a concordance, and the beginnings of network diagram illustrating what words are used “in the same breath” as other words. The purpose of the program is two-fold: to allow the reader to get more out of their text(s), and 2) to advertise some of the services of the Libraries’s fledgling Center For Digital Scholarship. I presented a “geek short” on the application.

The second and third ways I spent my time were in group sessions. One was on the intersection of digital humanities and the scholarly communications process. The second was on getting digital humanities projects off the ground. In both cases folks discussed ways to promote library services, and it felt as if we were all looking for new ways to be relevant compared to fifty years ago when the great libraries were defined by the sizes of their collections.

I’m glad I attended the meetings. The venue — Lawrence Technical University — is a small but growing institution. Detroit is a city of big road and big cars. The Detroit Art Institute was well-worth the $8 admission fee, even if you do get a $30 parking ticket.

Data Information Literacy @ Purdue

Posted on October 4, 2013 in Uncategorized by Eric Lease Morgan

By this time last week I had come and gone to the Data Information Literacy (DIL) Symposium at Purdue University. It was a very well-organized event, and I learned a number of things.

First of all, I believe the twelve DIL Competencies were well-founded and articulated:

  • conversion & interoperability
  • cultures of practice
  • curation & re-use
  • databases & formats
  • discovery & acquisition
  • ethics & attribution
  • management & organization
  • metadata & description
  • preservation
  • processing & analytics
  • quality & documentation
  • visualization & representation

For more detail of what these competencies mean and how they were originally articulated, see: Carlson, Jake R.; Fosmire, Michael; Miller, Chris; and Sapp Nelson, Megan, “Determining Data Information Literacy Needs: A Study of Students and Research Faculty” (2011). Libraries Faculty and Staff Scholarship and Research. Paper 23. http://docs.lib.purdue.edu/lib_fsdocs/23

I also learned about Bloom’s Taxonomy, a classification of learning objectives. At the bottom of this hierarchy/classification is remembering. The next level up is understanding. The third level is application. At the top of the hierarchy/classification is analysis, evaluation, and creation. According to the model, a person needs to move from remembering through to analysis, evaluation, and creation in order to really say they have learned something.

Some of my additional take-aways included: spend time teaching graduate students about data information literacy, and it is almost necessary to be imbedded or directly involved in the data collection process in order to have a real effect — get into the lab.

About 100 people attended the event. It was two days long. Time was not wasted. There were plenty of opportunities for discussion & interaction. Hat’s off to Purdue. From my point of view, y’all did a good job. “Thank you.”

3-D printing in the Center For Digital Scholarship

Posted on October 3, 2013 in Uncategorized by Eric Lease Morgan

"my" library

“my” library

This is the tiniest of blog postings outlining my experiences with 3-D printing.

The Libraries purchased a 3-D printer — a MakerBot Replicator 2X — and it arrived here in the Center For Digital Scholarship late last week. It can print things to sizes just smaller than a bread box — not very big. To make it go one feeds it a special file which moves — drives — a horizontal platform as well as a movable nozzle dispensing melted plastic. The “special file” is something only MakerBot understands, I think. But the process is more generalized than that. Ideally one would:

  1. use a CAD program to model a 3-D object
  2. convert the resulting CAD file to a MakerBot file
  3. print

Alternatively, a person can:

  1. visit Thingiverse
  2. download one of their thousands of files
  3. convert the file to a MakerBot file
  4. print

Another choice is to:

  1. visit TinkerCAD
  2. use their online software to design a model
  3. download the resulting file
  4. convert the file to a MakerBot file
  5. print

Yet another choice is to:

  1. obtain 123D Catch for your iPhone
  2. use it to take many photographs of an object
  3. edit and clean-up the resulting 3-D image with 123D Catch online
  4. download the resulting file
  5. convert the file to a MakerBot file
  6. print

The other day I downloaded a modeling program — 3-D Sculpt — for my iPad. Import a generic model. Use the tools to modify it. Save. Convert. Print.

To date I’ve only printed a bust of Michelangelo’s David and a model of a “library”. I’ve tried to print other sculptures but with little success.

How can this be used in a library, or more specifically, in our Center For Digital Scholarship? Frankly, I don’t know, yet, but I will think of something. For example, maybe I could print 3-D statistics. Or I could create a 3-D model representing the use of words in a book. Hmmm… Do you have any ideas?