Archive for the ‘Distant Reader’ Category

OpenRefine and the Distant Reader

Posted on February 10, 2020 in Distant Reader

The student, researcher, or scholar can use OpenRefine to open one or more different types of delimited files. OpenRefine will then parse the file(s) into fields. It can makes many things easy such as finding/replacing, faceting (think “grouping”), filtering (think “searching”), sorting, clustering (think “normalizing/cleannig”), counting & tabulating, and finally, exporting data. OpenRefine is an excellent go-between when spreadsheets fail and full-blown databases are too hard to use. OpenRefine eats delimited files for lunch.

Many (actually, most) of the files in a study carrel are tab-delimited files, and they will import into OpenRefine with ease. For example, after all a carrel’s part-of-speech (pos) files are imported into OpenRefine, the student, researcher, or scholar can very easily count, tabulate, search (filter), and facet on nouns, verbs, adjectives, etc. If the named entities files (ent) are imported, then it is easy to see what types of entities exist and who might be the people mentioned in the carrel:

pos

Facets (counts & tabulations) of parts-of-speech
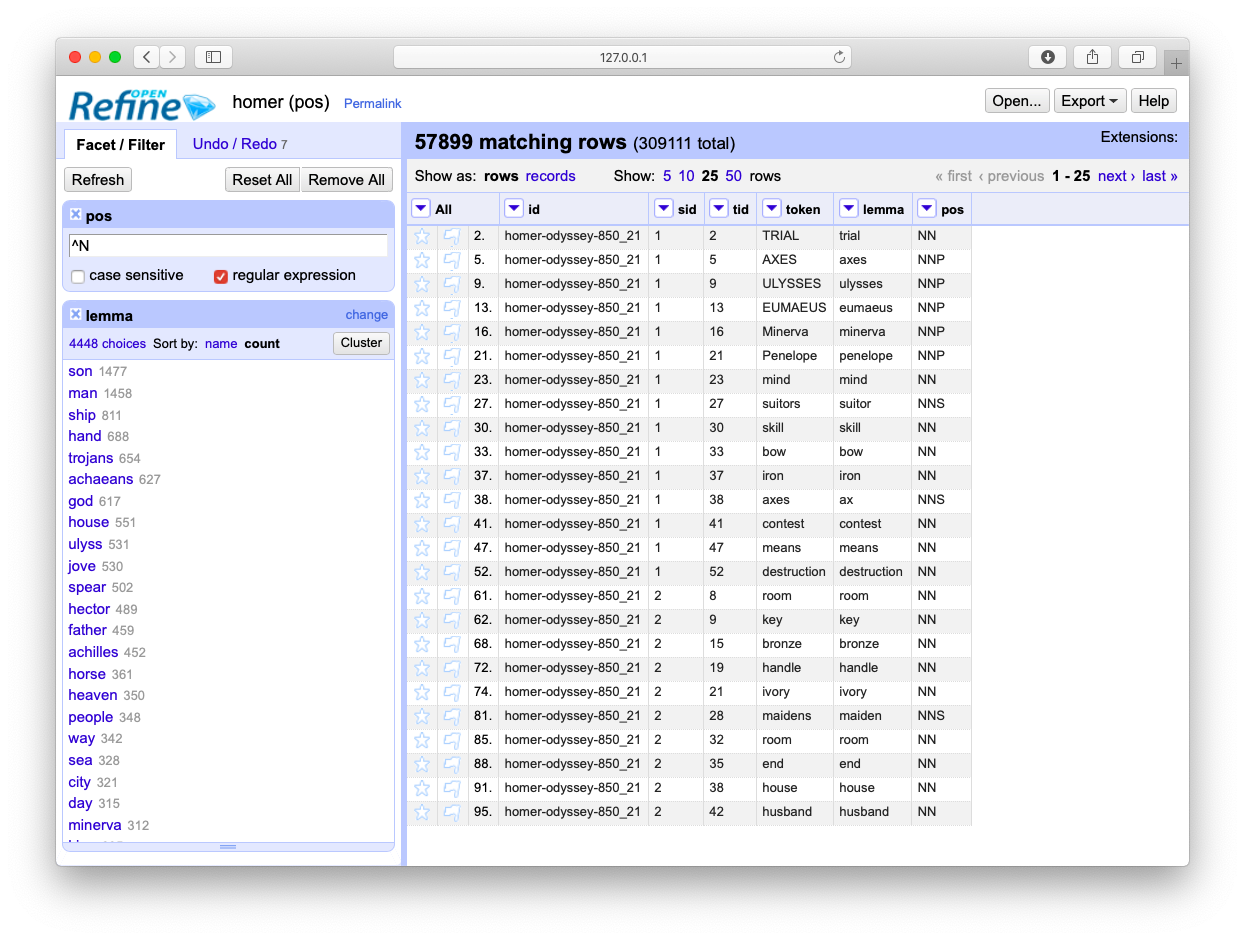
nouns

Most frequent nouns

entities

Types of named-entities

who

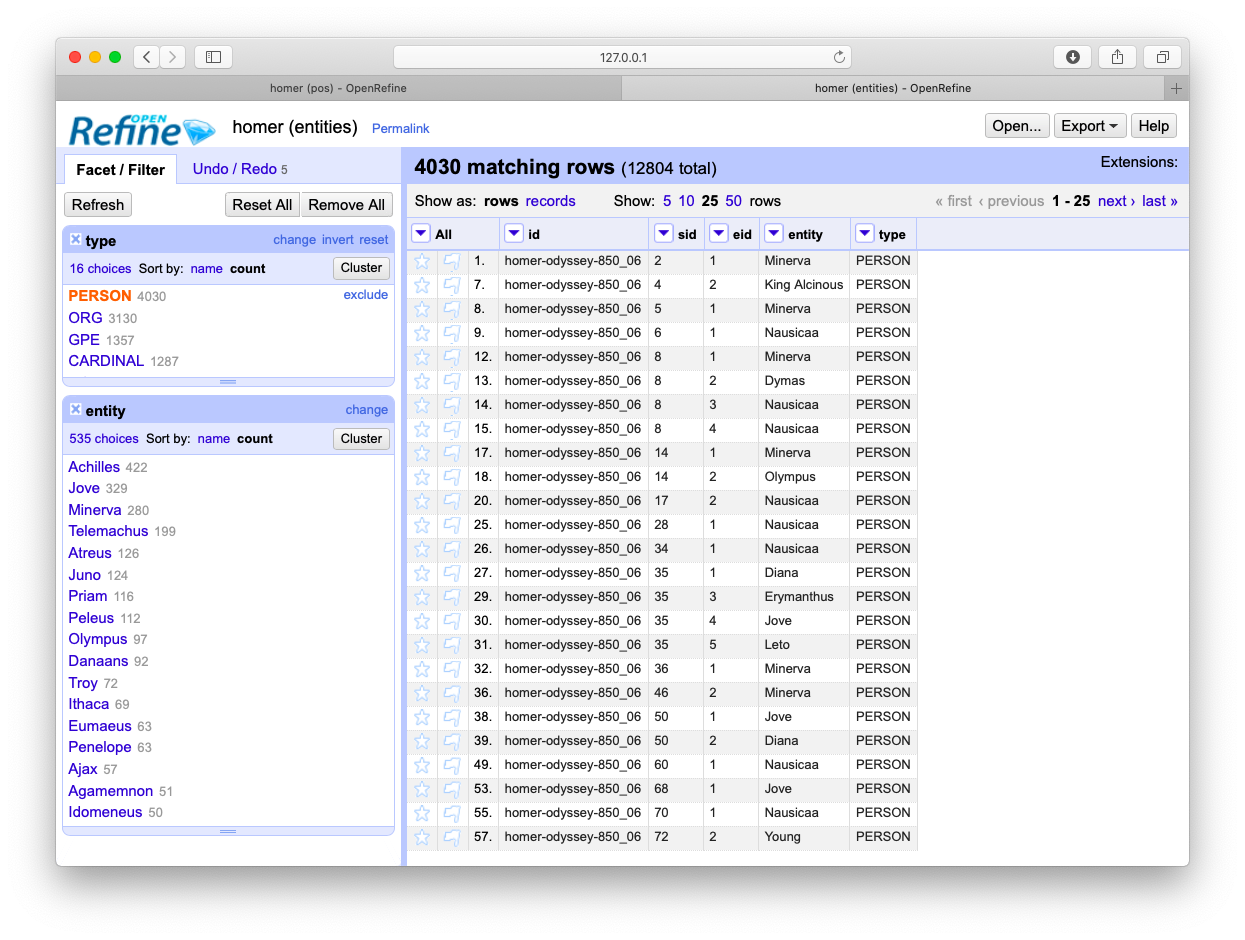
Who is mentioned in a file and how often

OpenRefine recipes

Like everything else, using OpenRefine requires practice. The problem to solve is not so much learning how to use OpenRefine. Instead, the problem to solve is to ask and answer interesting questions. That said, the student, researcher, or scholar will want to sort the data, search/filter the data, and compare pieces of the data to other pieces to articulate possible relationships. The following recipes endeavor to demonstrate some such tasks. The first is to simply facet (count & tabulate) on parts-of-speech files:

  1. Download, install, and run OpenRefine
  2. Create a new project and as input, randomly chose any file from a study carrel’s part-of-speech (pos) directory
  3. Continue to accept the defaults, and continue with “Create Project »”; the result ought to be a spreadsheet-like interface
  4. Click the arrow next to the POS column and select Facet/Text facet from the resulting menu; the result ought to be a new window containing a column of words and a column of frequencies — counts & tabulations of each type of part-of-speech in the file
  5. Go to Step #4, until you get tired, but this time facet by other values

Faceting is a whole like like “grouping” in the world of relational databases. Faceting alphabetically sorts a list and then counts the number of times each item appears in the list. Different types of works have different parts-of-speech ratios. For example, it is not uncommon for there to be a preponderance of past-tense verbs stories. Counts & tabulations of personal pronouns as well as proper nouns give senses of genders. A more in-depth faceting against adjectives allude to sentiment.

This recipe outlines how to filter (“search”):

  1. Click the “Remove All” button, if it exists; this ought to reset your view of the data
  2. Click the arrow next to the “token” column and select “Text filter” from the resulting menu
  3. In your mind, think of a word of interest, and enter it into the resulting search box
  4. Take notice of how the content in the spreadsheet view changes
  5. Go to Step #3 until you get tired
  6. Click the “Remove All” button to reset the view
  7. Text filter on the “token” column but search for “^N” (which is code for any noun) and make sure the “regular expression” check box is… checked
  8. Text facet on the “lemma” column; the result ought to be a count & tabulation of all the nouns
  9. Go to Step #6, but this time search for “^V” or “^J”, which are the codes for any verb or any adjective, respectively

By combining the functionalities of faceting and filtering the student, researcher, or scholar can investigate the original content more deeply or at least in different ways. The use of OpenRefine in this way is akin to leafing through book or a back-of-the-book index. As patterns & anomalies present themselves, they can be followed up more thoroughly through the use of a concordance and literally see the patterns & anomalies in context.

This recipe answers the question, “Who is mentioned in a corpus, and how often?“:

  1. Download, install, and run OpenRefine
  2. Create a new project and as input, select all of the files in the named-entity (ent) directory
  3. Continue to accept the defaults, but remember, all the almost all of the files in a study carrel are tab-delimited files, so remember to import them as “CSV / TSV / separator-based files”, not Excel files
  4. Continue to accept the defaults, and continue with “Create Project »”; the result ought to be a spreadsheet-like interface
  5. Click the arrow next to “type” column and select Facet/Text facet from the resulting menu; the result ought to be a new window containing a column of words and a column of frequencies — counts & tabulations of each type of named-entity in the whole of the study carrel
  6. Select “PERSON” from the list of named entities; the result ought to be a count & tabulation of the names of the people mentioned in the whole of the study carrel
  7. Go to Step #5 until tired, but each time select a different named-entity value

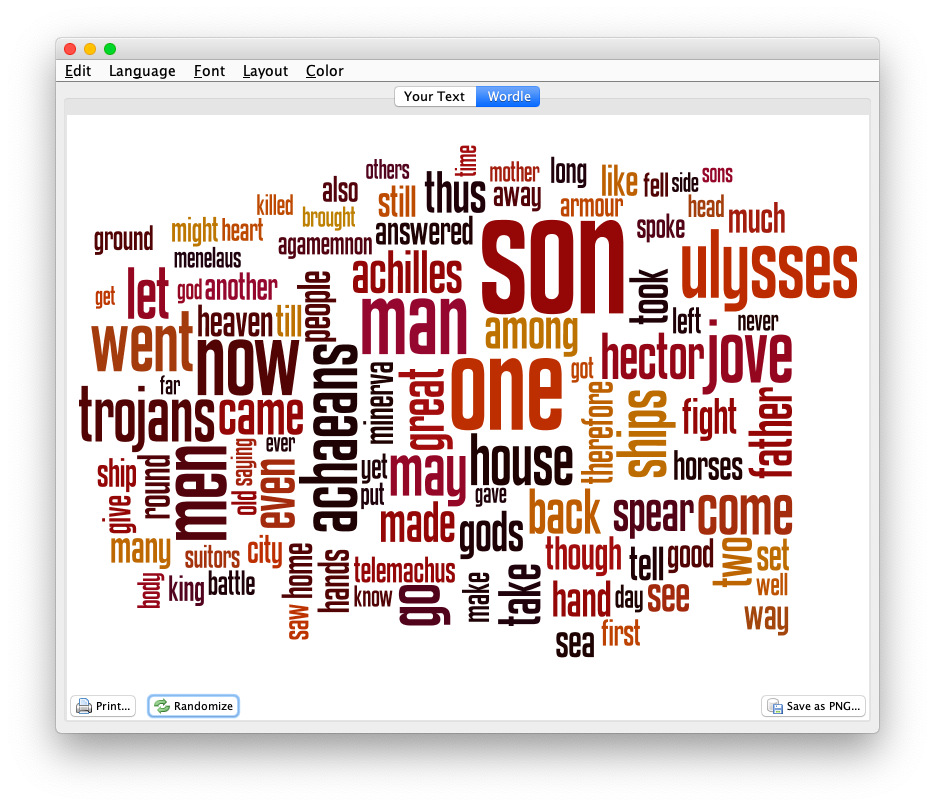
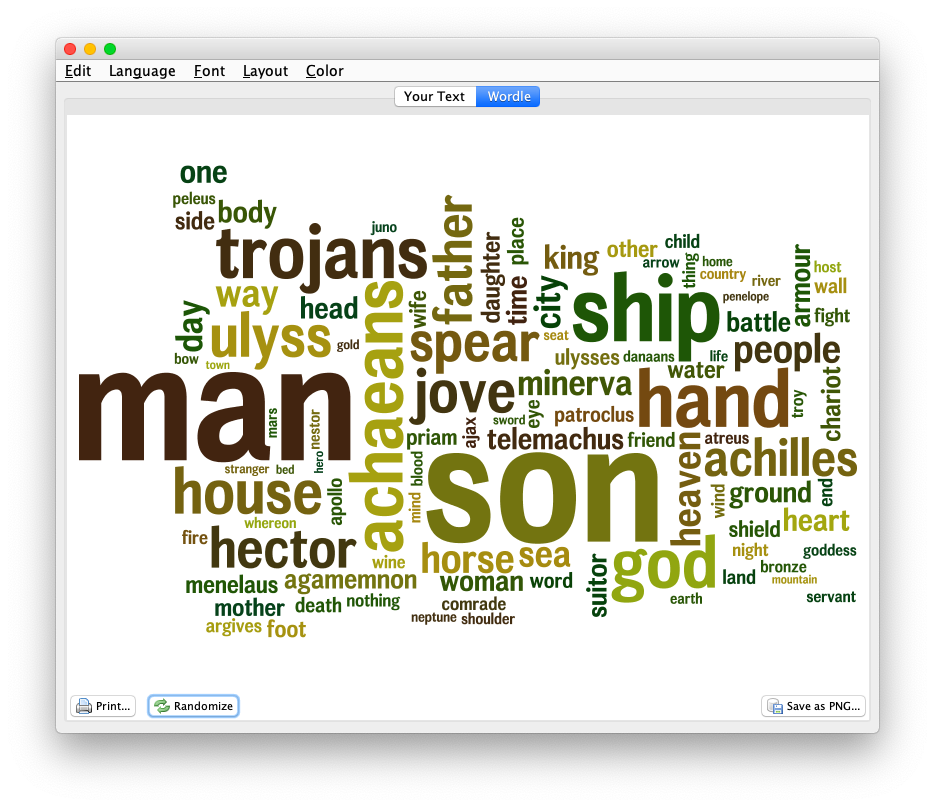
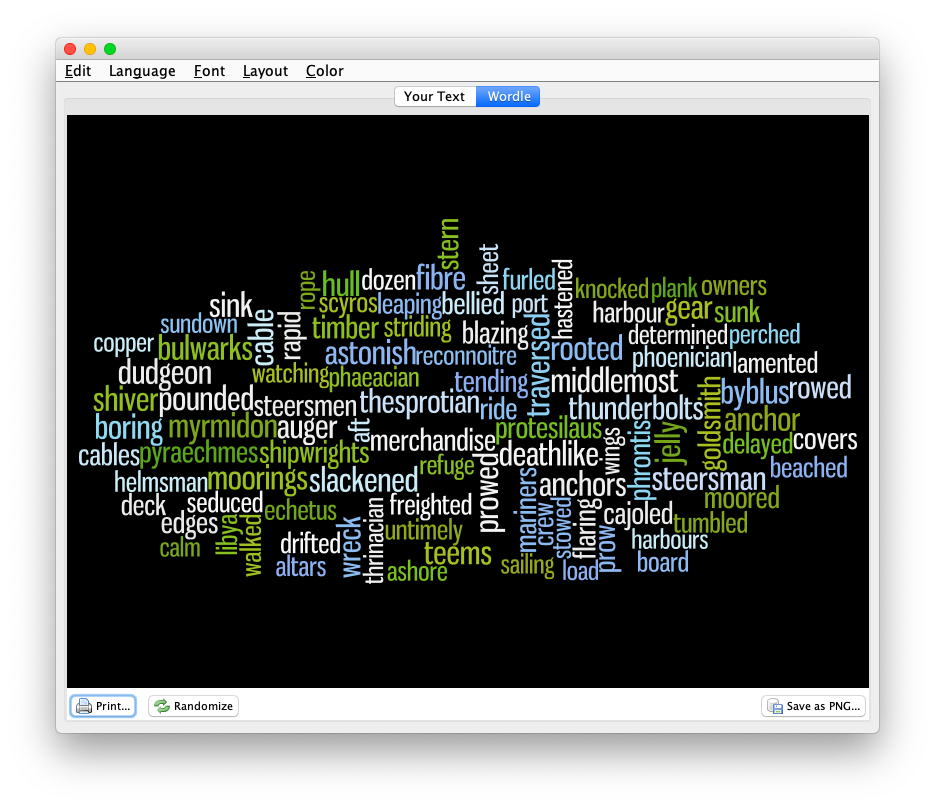
This final recipe is a visualization:

  1. Create a new parts-of-speech or named-entity project
  2. Create any sort of meaningful set of faceted results
  3. Select the “choices” link; the result ought to be a text area containing the counts & tabulation
  4. Copy the whole of the resulting text area
  5. Paste the result into your text editor, find all tab characters and change them to colons (:), copy the whole of the resulting text
  6. Open Wordle and create a word cloud with the contents of your clipboard; word counts may only illustrate frequencies, but sometimes the frequencies are preponderance.

A study carrel’s parts-of-speech (pos) and named-entities (ent) files enumerate each and every word or named-entity in each and every sentence of each and every item in the study carrel. Given a question relatively quantitative in nature and pertaining to parts-of-speech or named-entities, the pos and ent files are likely to be able to address the question. The pos and ent files are tab-delimited files, and OpenRefine is a very good tool for reading and analyzing such files. It does much more than was outlined here, but enumerating them here is beyond scope. Such is left up to the… reader.

Topic Modeling Tool – Enumerating and visualizing latent themes

Posted on February 6, 2020 in Distant Reader

Technically speaking, topic modeling is an unsupervised machine learning process used to extract latent themes from a text. Given a text and an integer, a topic modeler will count & tabulate the frequency of words and compare those frequencies with the distances between the words. The words form “clusters” when they are both frequent and near each other, and these clusters can sometimes represent themes, topics, or subjects. Topic modeling is often used to denote the “aboutness” of a text or compare themes between authors, dates, genres, demographics, other topics, or other metadata items.

Topic Modeling Tool is a GUI/desktop topic modeler based on the venerable MALLET suite of software. It can be used in a number of ways, and it is relatively easy to use it to: list five distinct themes from the Iliad and the Odyssey, compare those themes between books, and, assuming each chapter occurs chronologically, compare the themes over time.

topics

Simple list of topics

topics

Topics distributed across a corpus

topics

Comparing the two books of Homer

topics

Topics compared over time

Topic Modeling Tool Recipes

These few recipes are intended to get you up and running when it comes to Topic Modeling Tool. They are not intended to be a full-blown tutorial. This first recipe merely divides a corpus into the default number of topics and dimensions:

  1. Download and install Topic Modeling Tool
  2. Copy (not move) the whole of the txt directory to your computer’s desktop
  3. Create a folder/directory named “model” on your computer’s desktop
  4. Open Topic Modeling Tool
  5. Specify the “Input Dir…” to be the txt folder/directory on your desktop
  6. Specify the “Output Dir…” to be the folder/directory named “model” on your desktop
  7. Click “Learn Topics”; the result ought to be a a list of ten topics (numbered 0 to 9), and each topic is denoted with a set of scores and twenty words (“dimensions”), and while functional, such a result is often confusing

This recipe will make things less confusing:

  1. Change the number of topics from the default (10) to five (5)
  2. Click the “Optional Settings…” button
  3. Change the “The number of topic words to print” to something smaller, say five (5)
  4. Click the “Ok” button
  5. Click “Learn Topics”; the result will include fewer topics and fewer dimensions, and the result will probably be more meaningful, if not less confusing

There is no correct number of topics to extract with the process of topic modeling. “When considering the whole of Shakespeare’s writings, what is the number of topics it is about?” This being the case, repeat and re-repeat the previous recipe until you: 1) get tired, or 2) feel like the results are at least somewhat meaningful.

This recipe will help you make the results even cleaner by removing nonsense from the output:

  1. Copy the file named “stopwords.txt” from the etc directory to your desktop
  2. Click “Optional Settings…”; specify “Stopword File…” to be stopwords.txt; click “Ok”
  3. Click “Learn Topics”
  4. If the results contain nonsense words of any kind (or words that you just don’t care about), edit stopwords.txt to specify additional words to remove from the analysis
  5. Go to Step #3 until you get tired; the result ought to be topics with more meaningful words

Adding individual words to the stopword list can be tedious, and consequently, here is a power-user’s recipe to accomplish the same goal:

  1. Identify words or regular expressions to be excluded from analysis, and good examples include all numbers (\d+), all single-letter words (\b\w\b), or all two-letter words (\b\w\w\b)
  2. Use your text editor’s find/replace function to remove all occurrences of the identified words/patterns from the files in the txt folder/directory; remember, you were asked to copy (not move) the whole of the txt directory, so editing the files in the txt directory will not effect your study carrel
  3. Run the topic modeling process
  4. Go to Step #1 until you: 1) get tired, or 2) are satisfied with the results

Now that you have somewhat meaningful topics, you will probably want to visualize the results, and one way to do that is to illustrate how the topics are dispersed over the whole of the corpus. Luckily, the list of topics displayed in the Tool’s console is tab-delimited, making it easy to visualize. Here’s how:

  1. Topic model until you get a set of topics which you think is meaningful
  2. Copy the resulting topics, and this will include the labels (numbers 0 through n), the scores, and the topic words
  3. Open your spreadsheet application, and paste the topics into a new sheet; the result ought to be three columns of information (labels, scores, and words)
  4. Sort the whole sheet by the second column (scores) in descending numeric order
  5. Optionally replace the generic labels (numbers 0 through n) with a single meaningful word, thus denoting a topic
  6. Create a pie chart based on the contents of the first two columns (labels and scores); the result will appear similar to an illustration above and it will give you an idea of how large each topic is in relation to the others

Because of a great feature in Topic Modeling Tool it is relatively easy to compare topics against metadata values such as authors, dates, formats, genres, etc. To accomplish this goal the raw numeric information output by the Tool (the actual model) needs to be supplemented with metadata, the data then needs to be pivoted, and subsequently visualized. This is a power-user’s recipe because it requires: 1) a specifically shaped comma-separated values (CSV) file, 2) Python and a few accompanying modules, and 3) the ability to work from the command line. That said, here’s a recipe to compare & contrast the two books of Homer:

  1. Copy the file named homer-books.csv to your computer’s desktop
  2. Click “Optional Settings…”; specify “Metadata File…” to be homer-books.csv; click “Ok”
  3. Click “Learn Topics”; the result ought to pretty much like your previous results, but the underlying model has been enhanced
  4. Copy the file named pivot.py to your computer’s desktop
  5. When the modeling is complete, open up a terminal application and navigate to your computer’s desktop
  6. Run the pivot program (python pivot.py); the result ought to an error message outlining the input pivot.py expects
  7. Run pivot.py again, but this time give it input; more specifically, specify “./model/output_csv/topics-metadata.csv” as the first argument (Windows users will specify .\model\output_csv\topics-metadata.csv), specify “barh” for the second argument, and “title” as the third argument; the result ought to be a horizontal bar chart illustrating the differences in topics across the Iliad and the Odyssey, and ask yourself, “To what degree are the books similar?”

The following recipe is very similar to the previous recipe, but it illustrates the ebb & flow of topics throughout the whole of the two books:

  1. Copy the file named homer-chapters.csv to your computer’s desktop
  2. Click “Optional Settings…”; specify “Metadata File…” to be homer-chapters.csv; click “Ok”
  3. Click “Learn Topics”
  4. When the modeling is complete, open up a terminal application and navigate to your computer’s desktop
  5. Run pivot.py and specify “./model/output_csv/topics-metadata.csv” as the first argument (Windows users will specify .\model\output_csv\topics-metadata.csv), specify “line” for the second argument, and “title” as the third argument; the result ought to be a line chart illustrating the increase & decrease of topics from the beginning of the saga to the end, and ask yourself “What topics are discussed concurrently, and what topics are discussed when others are not?”

Topic modeling is an effective process for “reading” a corpus “from a distance”. Topic Modeling Tool makes the process easier, but the process requires practice. Next steps are for the student to play with the additional options behind the “Optional Settings…” dialog box, read the Tool’s documentation, take a look at the structure of the CSV/metadata file, and take a look under the hood at pivot.py.

The Distant Reader and concordancing with AntConc

Posted on January 31, 2020 in Distant Reader

Concordancing is really a process about find, and AntConc is a very useful program for this purpose. Given one or more plain text files, AntConc will enable the student, researcher, or scholar to: find all the occurrences of a word, illustrate where the word is located, navigate through document(s) where the word occurs, list word collocations, and calculate quite a number of useful statistics regarding a word. Concordancing, dating from the 13th Century, is the oldest form of text mining. Think of it as control-F (^f) on steroids. AntConc does all this and more. For example, one can load all of the Iliad and the Odyssey into AntConc. Find all the occurrences of the word ship, visualize where ship appears in each chapter, and list the most significant words associated with the word ship.

occurrences

Occurrences of a word

dispersion

Dispersion charts

interesting

“interesting” words

AntConc recipes

This recipe simply implements search:

  1. Download and install AntConc
  2. Use the “Open Files(s)…” menu option to open all files in the txt directory
  3. Select the Concordance tab
  4. Enter a word of interest into the search box
  5. Click the Start button

The result ought to be a list of phrases where the word of interest is displayed in the middle of the screen. In modern-day terms, such a list is called a “key word in context” (KWIC) index.

This recipe combines search with “control-F”:

  1. Select the Concordance tab
  2. Enter a word of interest into the search box
  3. Click the Start button
  4. Peruse the resulting phrases and click on one of interest; the result ought to a display of a text and the search term(s) is highlighted in the larger context
  5. Go to Step #1 until tired

This recipe produces a dispersion plot, an illustration of where a search term appears in a document:

  1. Select the Concordance tab
  2. Enter a word of interest into the search box
  3. Select the “Concordance Plot” tab

The result will be a list of illustrations. Each illustration will include zero or more vertical lines denoting the location of your search term in a given file. The more lines in each illustrations, the more times the search terms appear in the document.

This recipe counts & tabulates the frequency of words:

  1. Select the “Word List” tab
  2. Click the Start button; the result will be a list of all the words and their frequencies
  3. Scroll up and down the list to get a feel for what is common
  4. Select a word of interest; the result will be the same as if you entered the word in Recipe #1

It is quite probable the most frequent words will be “stop words” like the, a, an, etc. AntConc supports the elimination of stop words, and the Reader supplies a stop word list. Describing how to implement this functionality is too difficult to put into words. (No puns intended.) But here is an outline:

  1. Select the “Tool Preferences” menu option
  2. Select the “Word List” category
  3. Use the resulting dialog box to select a stop words list, and such a list is called stopwords.txt found in the etc directory
  4. Click the Apply button
  5. Go to Step #1; and the result will be a frequency list sans any stop words, and the result will be much more meaningful

Ideas are rarely articulated through the use of individual words; ideas are usually articulated through the use of sets of words (ngrams, sentences, paragraphs, etc.). Thus, as John Rupert Firth once said, “You shall know a word by the company it keeps.” This recipe outlines how to list word co-occurrences and collocations:

  1. Select the “Cluster/N-grams” tab
  2. Enter a word of interest in the search box
  3. Click the Start button; the result ought to be a list of two-word phrases (bigrams) sort in frequency order
  4. Select a phrase of interest, and the result will just as if you had search for the phrase in Recipe #1
  5. Go to Step #1 until tired
  6. Select the Collocates tab
  7. Enter a word of interest in the search box
  8. Click the Start button; the result ought to be a list of words and associated scores, and the scores compare the frequencies of the search word and the given word; words with higher scores can be considered “more interesting”
  9. Select “Sort by Freq” from the “Sort by” pop-up menu
  10. Click the Sort button; the result will be the same list of words and associated scores, but this time the list will be sorted by the frequency of the search term/given word combination

Again, a word is known by the company it keeps. Use the co-occurrences and collocations features to learn how a given word (or phrase) is associated with other words.

There is much more to AntConc than outlined in the recipes outlined above. Learning more is left up to you, the student, research, and scholar.

The Distant Reader Workbook

Posted on January 31, 2020 in Distant Reader

I am in the process of writing a/the Distant Reader workbook, which will make its debut at a Code4Lib preconference workshop in March. Below is both the “finished” introduction and table-of-contents.

Hands-on with the Distant Reader: A Workbook

This workbook outlines sets of hands-on exercises surrounding a computer system called the Distant Reader — https://distantreader.org.

By going through the workbook, you will become familiar with the problems the Distant Reader is designed to address, how to submit content to the Reader, how to download the results (affectionately called “study carrels”), and how to interpret them. The bulk of the workbook is about the later. Interpretation can be as simple as reading a narrative report in your Web browser, as complex as doing machine learning, and everything else in-between.

You will need to bring very little to the workbook in order to get very much out. At the very least, you will need a computer with a Web browser and an Internet connection. A text editor such as Notepad++ for Windows or BBEdit for Macintosh will come in very handy, but a word processor of any type will do in a pinch. You will want some sort of spreadsheet application for reading tabular data, and Microsoft Excel or Macintosh Numbers will both work quite well. All the other applications used in the workbook are freely available for downloading and cross-platform in nature. You may need to install a Java virtual machine in order to use some of them, but Java is probably already installed on your computer.

I hope you enjoy using the Distant Reader. It helps me use and understand large volumes of text quickly and easily.

Table of contents

    I. What is the Distant Reader, and why should I care?
       A. The Distant Reader is a tool for reading
       B. How it works
       C. What it does
   II. Five different types of input
       A. Introduction
       B. A file
       C. A URL
       D. A list of URLs
       E. A zip file
       F. A zip file with a companion CSV file
       F. Summary
  III. Submitting "experiments" and downloading "study carrels"
   IV. An introduction to study carrels
    V. The structured data of study carrels; taking inventory through the manifest
   VI. Using combinations of desktop tools to analyze the data
       A. Introduction - The three essential types of desktop tools
       B. Text editors
       C. Spreadsheet/database applications
       D. Analysis applications
           i. Wordle and Wordle recipes
          ii. AntConc and AntConc recipes
         iii. Excel and Excel recipes
          iv. OpenRefine and OpenRefine recipes
           v. Topic Modeling Tool and Tool recipes
  VII. Using command-line tools to dig even deeper
 VIII. Summary/conclusion
   IX. About the author

As per usual these days, the “code” is available on GitHub.

Wordle and the Distant Reader

Posted on January 29, 2020 in Distant Reader

Visualized word frequencies, while often considered sophomoric, can be quite useful when it comes to understanding a text, especially when the frequencies are focused on things like parts-of-speech, named entities, or co-occurrences. Wordle visualizes such frequencies very well. For example, the 100 most frequent words in the Iliad and the Odyssey, the 100 most frequent nouns in the Iliad and the Odyssey, or the statistically significant words associated with the word ship from the Iliad and the Odyssey.

words

simple word frequencies

nouns

frequency of nouns

ship

Significant words related to ship

Wordle recipes

Here is a generic Wordle recipe where Wordle will calculate the frequencies for you:

  1. Download and install Wordle. It is a Java application, so you may need to download and install Java along the way, but Java is probably already installed on your computer.
  2. Use your text editor to open reader.txt which is located in the etc directory/folder. Once opened, copy all of the text.
  3. Open Wordle, select the “Your Text” tab, and paste the whole of the text file into the window.
  4. Click the “Wordle” tab and your word cloud will be generated. Use the Wordle’s menu options to customize the output.

Congratulations, you have just visualized the whole of your study carrel.

Here is another recipe, a recipe where you supply the frequencies (or any other score):

  1. Download and install AntConc.
  2. Use the “Open Files(s)…” menu option to open any file in the txt directory.
  3. Click the “Word list” tab, and then click the “Start” button. The result will be a list of words and their frequencies.
  4. Use the “Save Output to Text File…” menu option, and save the frequencies accordingly.
  5. Open the resulting file in your spreadsheet.
  6. Remove any blank rows, and remove the columns that are not the words and their frequencies
  7. Invert the order of the remaining two columns; make the words the first column and the frequencies the second column.
  8. Copy the whole of the spreadsheet and paste it into your text editor.
  9. Use the text editor’s find/replace function to find all occurrences of the tab character and replace them with the colon (:) character. Copy the whole of the text editor’s contents.
  10. Open Wordle, click the “Your text” tab, paste the frequencies into the resulting window.
  11. Finally, click the “Wordle” tab to generate the word cloud.

Notice how you used a variety of generic applications to achieve the desired result. The word/value pairs given to Wordle do not have be frequencies. Instead they can be any number of different scores or weights. Keep your eyes open for word/value combinations. They are everywhere. Word clouds have been given a bad rap. Wordle is a very useful tool.

The Distant Reader and a Web-based demonstration

Posted on January 18, 2020 in Distant Reader

The following is an announcement of a Web-based demonstration to the Distant Reader:

Please join us for a web-based demo and Q&A on The Distant Reader, a web-based text analysis toolset for reading and analyzing texts that removes the hurdle of acquiring computational expertise. The Distant Reader offers a ready way to onboard scholars to text analysis and its possibilities. Eric Lease Morgan (Notre Dame) will demo his tool and answer your questions. This session is suitable for digital textual scholars at any level, from beginning to expert.

The Distant Reader: Reading at scale

The Distant Reader is a tool for reading. It takes an arbitrary amount of unstructured data (text) as input, and it outputs sets of structured data for analysis — reading. Given a corpus of just about any size (hundreds of books or thousands of journal articles), the Distant Reader analyzes the corpus, and outputs a myriad of reports enabling the researcher to use and understand the corpus. Designed with college students, graduate students, scientists, or humanists in mind, the Distant Reader is intended to supplement the traditional reading process.

This presentation outlines the problems the Reader is intended to address as well as the way it is implemented on the Jetstream platform with the help of both software and personnel resources from XSEDE. The Distant Reader is freely available for anybody to use at https://distantreader.org.

Other Distant Reader links of possible interest include:

‘Hope to see you there?

Distant Reader “study carrels”: A manifest

Posted on December 28, 2019 in Distant Reader

The results of the Distant Reader process is the creation of a “study carrel” — a set of structured data files intended to help you to further “read” your corpus. Using a previously created study carrel as an example, this blog posting enumerates & outlines the contents of a typical carrel. A future blog posting will describe ways to use & understand the files outlined here. Therefore, the text below is merely a kind of manifest.

wall-paper

Wall Paper by Eric

The Distant Reader takes an arbitrary amount of unstructured data (text) as input, and it outputs sets of structured data files for analysis — reading. Given a corpus of any size, the Distant Reader will analyze the corpus, and it will output a myriad of reports enabling you to use & understand the corpus. The Distant Reader is intended to supplement the traditional reading process. Given a question of a rather quantitative nature, a Distant Reader study carrel may very well contain a plausible answer.

The results of downloading and uncompressing the Distant Reader study carrel is a directory/folder containing a standard set of files and subdirectories. Each of these files and subdirectories are listed & described below:

  • A1426341535 – This, or a very similarly named file, is an administrative file, a unique identifier created by the system (Airivata) which processed the study carrel. [1] In the future, this file may not be included. On the other hand, since the file’s name is a unique identifier, then it could be exploited by a developer.
  • adr – This subdirectory contains a set of tab-delimited files. Each file contains a set of email addresses extracted from the documents in your corpus. While the files’ names end in .adr, they are plain text files that can be imported into for favorite spreadsheet, database, or analysis application. The files have two columns: 1) id, and 2) address. The definitions of these columns and possible uses of these files are described elsewhere, but in short, these files can humorously answer the question “Who are you gonna call?”
  • bib – This subdirectory contains a set of tab-delimited files. Each file contains a set of rudimentary bibliographic information from a given document in your corpus. While the files’ names end in .bib, they are plain text files that can be imported into for favorite spreadsheet, database, or analysis application. The files have thirteen columns: 1) id, 2) author, 3) title, 4) date, 5) page 6), extension, 7) mime, 8) words, 9) sentences, 10) flesch, 11) summary, 12) cache, and 13) txt. The definitions of these columns and possible uses of these files are described elsewhere, but in short, these files help answer the question “What items are in my corpus, and how can they be described?”
  • cache – This subdirectory contains original copies of the files you intended for analysis. It is populated by harvesting content from URLs or were supplied in the zip file you uploaded to the Reader. Each file is named with a unique and somewhat meaningful name and an extension. These files are intended for reading on your computer, or better yet, printed and then read in the more traditional manner.
  • css – This subdirectory contains a set of cascading stylesheets used by the HTML files in the carrel. If you really desired, one could edit these files in order to change the appearance of the carrel.
  • input.zip – This file, or something named very similarly, is the file originally used to create your study carrel. It has already served its intended purpose, but it is retained for reasons of provenance.
  • ent – This subdirectory contains a set of tab-delimited files, and each file contains a set of named entities from a given document in your corpus. While the files’ names end in .ent, they are plain text files that can be imported into for favorite spreadsheet, database, or analysis application. The files have five columns: 1) id, 2) sid, 3) eid, 4) entity, and 5) type. The definitions of these columns and possible uses of these files are described elsewhere, but in short, these files help answer questions regarding who, what, when, where, how, and how many.
  • etc – This subdirectory contains a set of ancillary files, and each are described below:
    • model-data.txt – the data file used by topic-model.htm, and it is essentially an enhanced version of reader.txt
    • queries.sql – a set of SQL queries used to generate report.txt, and this file is an excellent introduction to the use of reader.db
    • reader.db – an SQLite database file, and it is essentially the amalgamation of the contents of the adr, bib, ent, pos, urls, and wrd directories; the intelligent use of this file can be used to answer just about any question answerable by the carrel
    • reader.sql – a set SQL commands denoting the structure of reader.db
    • reader.txt – the concatenation of all files in the txt directory; a plain text version of the whole of the corpus is often used for other purposes and it is provided here as a convienence
    • report.txt – the result of applying queries.sql to reader.db; this file has the exact same content as standard-output.txt
    • stopwords.txt – a list of function words (i.e. “a”, “an”, “the”, etc.) used through the creation of the study carrel
  • figures – This subdirectory contains a set of image files used by the carrel’s HTML files:
    • adjectives.png – a word cloud illustrating the most frequent adjectives in the corpus
    • adverbs.png – a word cloud illustrating the most frequent adverbs in the corpus
    • bigrams.png – a word cloud illustrating the most frequent bigrams (two-word phrases) in the corpus
    • flesch-boxplot.png – a box plot illustrating the average, quartile, and outlier readability scores of the items in the corpus
    • flesch-histogram.png – a histogram illustrating the distribution of readability scores of the items in the corpus
    • keywords.png – a word cloud illustrating the most frequent keywords (statistically significant unigrams) in the corpus
    • nouns.png – a word cloud illustrating the most frequent nouns in the corpus
    • pronouns.png – a word cloud illustrating the most frequent pronouns in the corpus
    • proper-nouns.png – a word cloud illustrating the most frequent proper nouns in the corpus
    • sizes-boxplot.png – a box plot illustrating the average, quartile, and outlier sizes of the items (measured in unigrams) in the corpus
    • sizes-histogram.png – a histogram illustrating the distribution of sizes of the items (measured in unigrams) in the corpus
    • topics.png – a pie chart illustrating how the corpus is subdivided if topic modeling were applied to the corpus, and the desired number of topics (latent themes) equals five
    • unigrams.png – a word cloud illustrating the most frequent unigrams (individual words) in the corpus
    • verbs.png – a word cloud illustrating the most frequent verbs in the corpus
  • htm – This subdirectory contains a set of interactive HTML files linked from the file named index.htm. The functionality of each file is outlined below:
    • adjective-noun.htm – search, sort, and browse adjective/noun combinations by adjective, noun, or frequency
    • adjectives.htm – search, sort, and browse adjectives and/or their frequency
    • adverbs.htm – search, sort, and browse adverbs and/or their frequency
    • bigrams.htm – search, sort, and browse bigrams (two-word phrases) and/or their frequency
    • entities.htm – search, sort, and browse named-entities, their type, and/or their frequency
    • keywords.htm – search, sort, and browse keywords (statistically significant unigrams) and/or their frequency
    • noun-verb.htm – search, sort, and browse noun/verb combinations by noun, verb, or frequency
    • nouns.htm – search, sort, and browse nouns and/or their frequency
    • pronouns.htm – search, sort, and browse pronouns and/or their frequency
    • proper-nouns.htm – search, sort, and browse proper nouns and/or their frequency
    • quadgrams.htm – search, sort, and browse quadgrams (four-word phrases) and/or their frequency
    • questions.htm – search, sort, and browse questions (sentences ending with a question mark) and from which items they were extracted
    • search.htm – a free text query interface based on the narrative summaries of each item in the corpus
    • topic-model.htm – a topic modeler; a tool used to enumerate as well as compare & contrast latent themes in the corpus
    • trigrams.htm – search, sort, and browse trigrams (three-word phrases) and/or their frequency
    • unigrams.htm – search, sort, and browse unigrams (individual words) and/or their frequency
    • verbs.htm – search, sort, and browse verbs and/or their frequencies
  • index.htm – This HTML file narratively reports on the content of your study carrel. It is the best place to begin once you have downloaded and unzipped the carrel.
  • MANIFEST.htm – This file, and it is the third best place to begin once you have downloaded and unzipped a carrel.
  • job_1819387465.slurm – This file, or a very similarly named file, is the batch file used to initially create your study carrel. In the future, this file may be removed from the study carrel all together because it serves only an administrative purpose.
  • js – This subdirectory includes a set of Javascript libraries supporting the functionality of index.htm as well as the HTML files in the htm directory. Because these files are here your computer does not need to be connected to the Internet in order to effectively read your carrel. Study carrels are designed to be stand-alone file systems usable for years to come.
  • LICENSE – This is the license file; each study carrel is distributed under a GNU Public License.
  • pos – This subdirectory contains a set of tab-delimited files, and each file contains a set of part-of-speech files from a given document in your corpus. While the files’ names end in .pos, they are plain text files that can be imported into for favorite spreadsheet, database, or analysis application. The files have six columns: 1) id, 2) sid, 3) tid, 4) token, 5) lemma, and 6) pos. The definitions of these columns are described in another blog posting. The definitions of these columns and possible uses of these files are described elsewhere, but in short, these files help answer question regarding who, what, how, how many, and actions as well as grammer and style.
  • README – This file contains the very briefest of introductions to the carrel.
  • standard-error.txt – As each study carrel is being created, error and status messages are output to this file. It is a log file. If the creation of your study carrel fails, then this is a good place to look for clues on what went wrong. Send me this file if you are stymied.
  • standard-output.txt – After your study carrel as been created and distilled into a database, sets of queries are applied against the database. This file is the second best place to begin once you have downloaded and unzipped a carrel.
  • tsv – Except for one (questions.tsv), this subdirectory contains a set of frequency tables in the form of tab-delimited text files. The exception is a tab-delimited text file too, but it is just not a frequency file. All of these files can be imported into for favorite spreadsheet, database, or analysis application. Possible uses for these files are destined to be outlined in future postings, but in short, perusal of these files will help you answer questions regarding your corpus’s “aboutness” as well as who, what, when, where, how, how many, and why questions. The structure of each file is listed below:
    • adjective-noun.tsv – three columns: 1) adjective, 2) noun, and 3) frequency where frequency denotes the number of times the given adjective appears immediately before the given noun in the corpus
    • adjectives.tsv – two columns: 1) adjective, and 2) frequency
    • adverbs.tsv – two columns: 1) adverb, and 2) frequency
    • bigrams.tsv – two columns: 1) bigram (two-word phrase), and 2) frequency
    • entities.tsv – three columns: 1) entity, 2) type, and 3) frequency
    • keywords.tsv – two columns: 1) keyword (statistically significant unigram), and 2) frequency
    • noun-verb.tsv – three columns: 1) noun, 2) verb, and 3) a frequency where frequency denotes the number of times the given noun appears immediately before the given verb in the entire corpus
    • nouns.tsv – two columns: 1) noun, and 2) frequency
    • pronouns.tsv – two columns: 1) pronoun, and 2) frequency
    • proper-nouns.tsv – two columns: 1) proper, and 2) frequency
    • quadgrams.tsv – two columns: 1) quadgram (four-word phrase), and 2) frequency
    • questions.tsv – two columns: 1) identifier, and 2) question where each question is a “sentence” ending in a question mark
    • trigrams.tsv – two columns: 1) trigram (three-word phrase), and 2) frequency
    • unigrams.tsv – two columns: 1) unigram (individual word), and 2) frequency
    • verbs.tsv – two columns: 1) verb, and 2) frequency
  • txt – This subdirectory contains plain text versions of the files stored in the cache directory. A plain text version of each & every item in the cache directory ought to exist in this directory. The contents of this directory is what was used to do the Reader’s analysis. The contents of this directory are excellent candidates for further analysis with tools such as concordances, indexers, or topic modelers.
  • urls – This subdirectory contains a set of tab-delimited files, and each file contains a set of URLs from a given document in your corpus. While the files’ names end in .url, they are plain text files that can be imported into for favorite spreadsheet, database, or analysis application. The files have three columns: 1) id, 2) domain, and 3) url. The definitions of these columns and possible uses of these files are described elsewhere, but in short, these files help answer questions regarding document provenance and relationships as well as addressing the perenial issue of “finding more like this one”.
  • wrd – This subdirectory contains a set of tab-delimited files, and each file contains a set of computed keywords from a given document in your corpus. While the files’ names end in .wrd, they are plain text files that can be imported into for favorite spreadsheet, database, or analysis application. The files have two columns: 1) id, and 2 keyword. The definitions of these columns and possible uses of these files are described elsewhere, but in short, these files help answer questions such as “What is this document about?”

Links

[1] Airivata – https://airavata.apache.org

A Distant Reader Field Trip to Bloomington

Posted on December 17, 2019 in Distant Reader

Yesterday I was in Bloomington (Indiana) for a Distant Reader field trip.

More specifically, I met with Marlon Pierce and Team XSEDE to talk about Distant Reader next steps. We discussed the possibility of additional grant opportunities, possible ways to exploit the Airivata/Django front-end, and Distant Reader embellishments such as:

  1. Distant Reader Lite – a desktop version of the Reader which processes single files
  2. Distant Reader Extras – a suite of tools for managing collections of “study carrels”
  3. The Distant Reader Appliance – a stand-alone piece of hardware built with Raspberry Pi’s

Along the way Marlon & I visited the data center where I actually laid hands on the Reader. We also visited John Walsh of the HathiTrust Research Center where I did a two-fold show & tell: 1) downloading HathiTrust plain text files as well as PDF documents using htid2books, and 2) the Distant Reader, of course. As a bonus, there was cool mobile hanging from the ceiling of Luddy Hall.

“A good time was had by all.”

eric and marlon

reader

mobile

What is the Distant Reader and why should I care?

Posted on November 9, 2019 in Distant Reader

The Distant Reader is a tool for reading. [1]

wall paper by eric

Wall Paper by Eric

The Distant Reader takes an arbitrary amount of unstructured data (text) as input, and it outputs sets of structured data for analysis — reading. Given a corpus of any size, the Distant Reader will analyze the corpus, and it will output a myriad of reports enabling you to use & understand the corpus. The Distant Reader is intended to supplement the traditional reading process.

The Distant Reader empowers one to use & understand large amounts of textual information both quickly & easily. For example, the Distant Reader can consume the entire issue of a scholarly journal, the complete works of a given author, or the content found at the other end of an arbitrarily long list of URLs. Thus, the Distant Reader is akin to a book’s table-of-contents or back-of-the-book index but at scale. It simplifies the process of identifying trends & anomalies in a corpus, and then it enables a person to further investigate those trends & anomalies.

The Distant Reader is designed to “read” everything from a single item to a corpus of thousand’s of items. It is intended for the undergraduate student who wants to read the whole of their course work in a given class, the graduate student who needs to read hundreds (thousands) of items for their thesis or dissertation, the scientist who wants to review the literature, or the humanist who wants to characterize a genre.

How it works

The Distant Reader takes five different forms of input:

  1. a URL – good for blogs, single journal articles, or long reports
  2. a list of URLs – the most scalable, but creating the list can be problematic
  3. a file – good for that long PDF document on your computer
  4. a zip file – the zip file can contain just about any number of files from your computer
  5. a zip file plus a metadata file – with the metadata file, the reader’s analysis is more complete

Once the input is provided, the Distant Reader creates a cache — a collection of all the desired content. This is done via the input or by crawling the ‘Net. Once the cache is collected, each & every document is transformed into plain text, and along the way basic bibliographic information is extracted. The next step is analysis against the plain text. This includes rudimentary counts & tabulations of ngrams, the computation of readability scores & keywords, basic topic modeling, parts-of-speech & named entity extraction, summarization, and the creation of a semantic index. All of these analyses are manifested as tab-delimited files and distilled into a single relational database file. After the analysis is complete, two reports are generated: 1) a simple plain text file which is very tabular, and 2) a set of HTML files which are more narrative and graphical. Finally, everything that has been accumulated & generated is compressed into a single zip file for downloading. This zip file is affectionately called a “study carrel“. It is completely self-contained and includes all of the data necessary for more in-depth analysis.

What it does

The Distant Reader supplements the traditional reading process. It does this in the way of traditional reading apparatus (tables of content, back-of-book indexes, page numbers, etc), but it does it more specifically and at scale.

Put another way, the Distant Reader can answer a myriad of questions about individual items or the corpus as a whole. Such questions are not readily apparent through traditional reading. Examples include but are not limited to:

  • How big is the corpus, and how does its size compare to other corpora?
  • How difficult (scholarly) is the corpus?
  • What words or phrases are used frequently and infrequently?
  • What statistically significant words characterize the corpus?
  • Are there latent themes in the corpus, and if so, then what are they and how do they change over both time and place?
  • How do any latent themes compare to basic characteristics of each item in the corpus (author, genre, date, type, location, etc.)?
  • What is discussed in the corpus (nouns)?
  • What actions take place in the corpus (verbs)?
  • How are those things and actions described (adjectives and adverbs)?
  • What is the tone or “sentiment” of the corpus?
  • How are the things represented by nouns, verbs, and adjective related?
  • Who is mentioned in the corpus, how frequently, and where?
  • What places are mentioned in the corpus, how frequently, and where?

People who use the Distant Reader look at the reports it generates, and they often say, “That’s interesting!” This is because it highlights characteristics of the corpus which are not readily apparent. If you were asked what a particular corpus was about or what are the names of people mentioned in the corpus, then you might answer with a couple of sentences or a few names, but with the Distant Reader you would be able to be more thorough with your answer.

The questions outlined above are not necessarily apropos to every student, researcher, or scholar, but the answers to many of these questions will lead to other, more specific questions. Many of those questions can be answered directly or indirectly through further analysis of the structured data provided in the study carrel. For example, each & every feature of each & every sentence of each & every item in the corpus has been saved in a relational database file. By querying the database, the student can extract every sentence with a given word or matching a given grammer to answer a question such as “How was the king described before & after the civil war?” or “How did this paper’s influence change over time?”

A lot of natural language processing requires pre-processing, and the Distant Reader does this work automatically. For example, collections need to be created, and they need to be transformed into plain text. The text will then be evaluated in terms of parts-of-speech and named-entities. Analysis is then done on the results. This analysis may be as simple as the use of concordance or as complex as the application of machine learning. The Distant Reader “primes the pump” for this sort of work because all the raw data is already in the study carrel. The Distant Reader is not intended to be used alone. It is intended to be used in conjunction with other tools, everything from a plain text editor, to a spreadsheet, to database, to topic modelers, to classifiers, to visualization tools.

Conclusion

I don’t know about you, but now-a-days I can find plenty of scholarly & authoritative content. My problem is not one of discovery but instead one of comprehension. How do I make sense of all the content I find? The Distant Reader is intended to address this question by making observations against a corpus and providing tools for interpreting the results.

Links

[1] Distant Reader – https://distantreader.org

Project Gutenberg and the Distant Reader

Posted on November 6, 2019 in Distant Reader

The venerable Project Gutenberg is perfect fodder for the Distant Reader, and this essay outlines how & why. (tl;dnr: Search my mirror of Project Gutenberg, save the result as a list of URLs, and feed them to the Distant Reader.)

Project Gutenberg

wall paper by Eric

Wall Paper by Eric

A long time ago, in a galaxy far far away, there was a man named Micheal Hart. Story has it he went to college at the University of Illinois, Urbana-Champagne. He was there during a summer, and the weather was seasonably warm. On the other hand, the computer lab was cool. After all, computers run hot, and air conditioning is a must. To cool off, Micheal went into the computer lab to be in a cool space.† While he was there he decided to transcribe the United States Declaration of Independence, ultimately, in the hopes of enabling people to use a computers to “read” this and additional transcriptions. That was in 1971. One thing led to another, and Project Gutenberg was born. I learned this story while attending a presentation by the now late Mr. Hart on Saturday, February 27, 2010 in Roanoke (Indiana). As it happened it was also Mr. Hart’s birthday. [1]

To date, Project Gutenberg is a corpus of more than 60,000 freely available transcribed ebooks. The texts are predominantly in English, but many languages are represented. Many academics look down on Project Gutenberg, probably because it is not as scholarly as they desire, or maybe because the provenance of the materials is in dispute. Despite these things, Project Gutenberg is a wonderful resource, especially for high school students, college students, or life-long learners. Moreover, its transcribed nature eliminates any problems of optical character recognition, such as one encounters with the HathiTrust. The content of Project Gutenberg is all but perfectly formatted for distant reading.

Unfortunately, the interface to Project Gutenberg is less than desirable; the index to Project Gutenberg is limited to author, title, and “category” values. The interface does not support free text searching, and there is limited support for fielded searching and Boolean logic. Similarly, the search results are not very interactive nor faceted. Nor is there any application programmer interface to the index. With so much “clean” data, so much more could be implemented. In order to demonstrate the power of distant reading, I endeavored to create a mirror of Project Gutenberg while enhancing the user interface.

To create a mirror of Project Gutenberg, I first downloaded a set of RDF files describing the collection. [2] I then wrote a suite of software which parses the RDF, updates a database of desired content, loops through the database, caches the content locally, indexes it, and provides a search interface to the index. [3, 4] The resulting interface is ill-documented but 100% functional. It supports free text searching, phrase searching, fielded searching (author, title, subject, classification code, language) and Boolean logic (using AND, OR, or NOT). Search results are faceted enabling the reader to refine their query sans a complicated query syntax. Because the cached content includes only English language materials, the index is only 33,000 items in size.

Project Gutenberg & the Distant Reader

The Distant Reader is a tool for reading. It takes an arbitrary amount of unstructured data (text) as input, and it outputs sets of structured data for analysis — reading. Given a corpus of any size, the Distant Reader will analyze the corpus, and it will output a myriad of reports enabling you to use & understand the corpus. The Distant Reader is intended to supplement the traditional reading process. Project Gutenberg and the Distant Reader can be used hand-in-hand.

As described in a previous posting, the Distant Reader can take five different types of input. [5] One of those inputs is a file where each line in the file is a URL. My locally implemented mirror of Project Gutenberg enables the reader to search & browse in a manner similar to the canonical version of Project Gutenberg, but with two exceptions. First & foremost, once a search has been gone against my mirror, one of the resulting links is “only local URLs”. For example, below is an illustration of the query “love AND honor AND truth AND justice AND beauty”, and the “only local URLs” link is highlighted:

search result

Search result

By selecting the “only local URLs”, a list of… URLs is returned, like this:

urls

URLs

This list of URLs can then be saved as file, and any number of things can be done with the file. For example, there are Google Chrome extensions for the purposes of mass downloading. The file of URLs can be fed to command-line utilities (ie. curl or wget) also for the purposes of mass downloading. In fact, assuming the file of URLs is named love.txt, the following command will download the files in parallel and really fast:

cat love.txt | parallel wget

This same file of URLs can be used as input against the Distant Reader, and the result will be a “study carrel” where the whole corpus could be analyzed — read. For example, the Reader will extract all the nouns, verbs, and adjectives from the corpus. Thus you will be able to answer what and how questions. It will pull out named entities and enable you to answer who and where questions. The Reader will extract keywords and themes from the corpus, thus outlining the aboutness of your corpus. From the results of the Reader you will be set up for concordancing and machine learning (such as topic modeling or classification) thus enabling you to search for more narrow topics or “find more like this one”. The search for love, etc returned more than 8000 items. Just less than 500 of them were returned in the search result, and the Reader empowers you to read all 500 of them at one go.

Summary

Project Gutenberg is very useful resource because the content is: 1) free, and 2) transcribed. Mirroring Project Gutenberg is not difficult, and by doing so an interface to it can be enhanced. Project Gutenberg items are perfect items for reading & analysis by the Distant Reader. Search Project Gutenberg, save the results as a file, feed the file to the Reader and… read the results at scale.

Notes and links

† All puns are intended.

[1] Michael Hart in Roanoke (Indiana) – video: https://youtu.be/eeoBbSN9Esg; blog posting: http://infomotions.com/blog/2010/03/michael-hart-in-roanoke-indiana/

[2] The various Project Gutenberg feeds, including the RDF is located at https://www.gutenberg.org/wiki/Gutenberg:Feeds

[3] The suite of software to cache and index Project Gutenberg is available on GitHub at https://github.com/ericleasemorgan/gutenberg-index

[4] My full text index to the English language texts in Project Gutenberg is available at http://dh.crc.nd.edu/sandbox/gutenberg/cgi-bin/search.cgi

[5] The Distant Reader and its five different types of input – http://sites.nd.edu/emorgan/2019/10/dr-inputs/